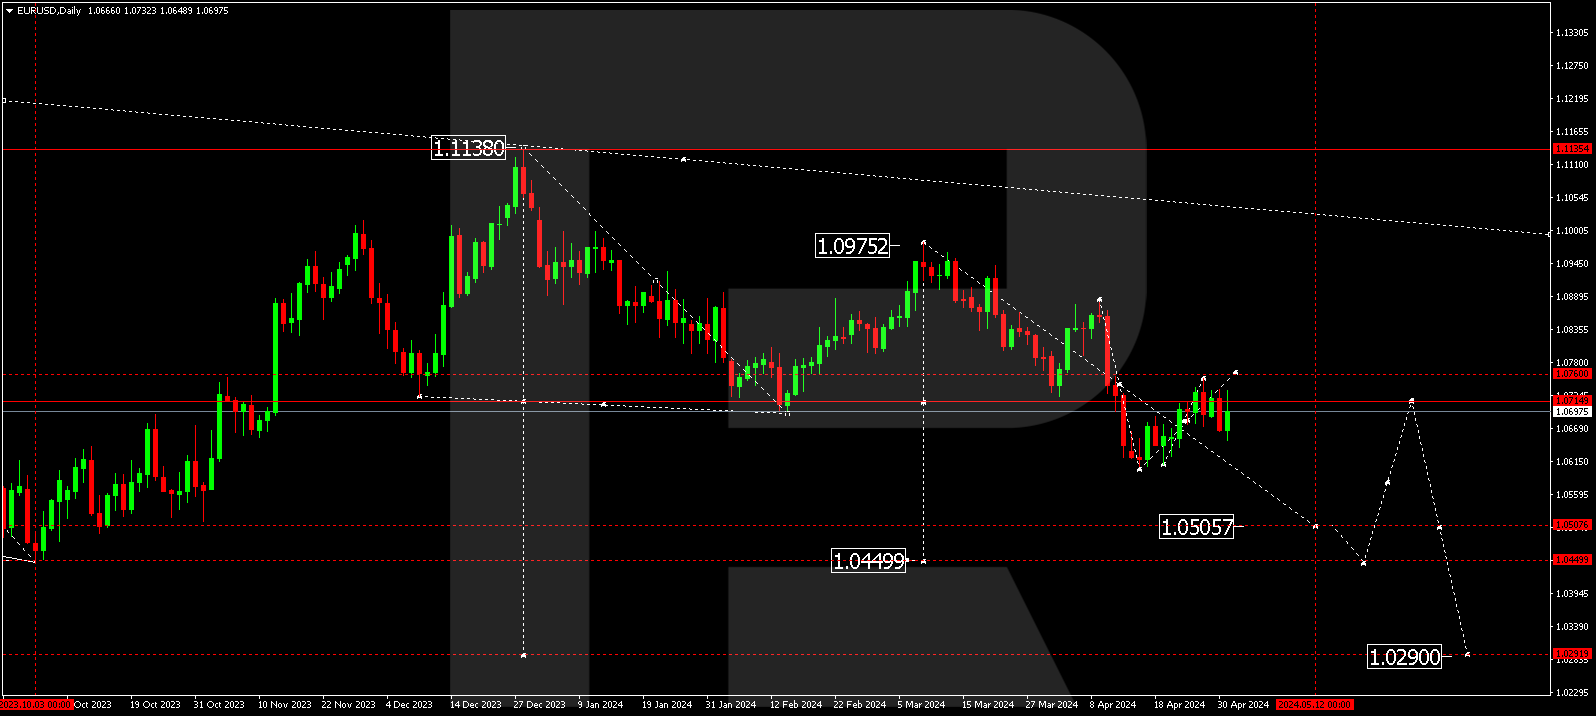
EURUSD, “Euro vs US Dollar”
The daily chart of EURUSD shows that after finishing the “bearish” phase close to 50.0% fibo at 1.1493, the asset is starting a new movement to the upside. Convergence on MACD says this movement may be both a correction and a reversal to break the high at 1.2350. After the pullback is over, the pair may resume moving downwards to reach 50.0% and 61.8% fibo at 1.1493 and 1.1293 respectively.

The H1 chart shows the potential correctional targets after local convergence on MACD – 23.6%, 38.2%, and 50.0% fibo at 1.1700, 1.1808, and 1.1895 respectively. On the other hand, a breakout of the low at 1.1529 will lead to a further downtrend.

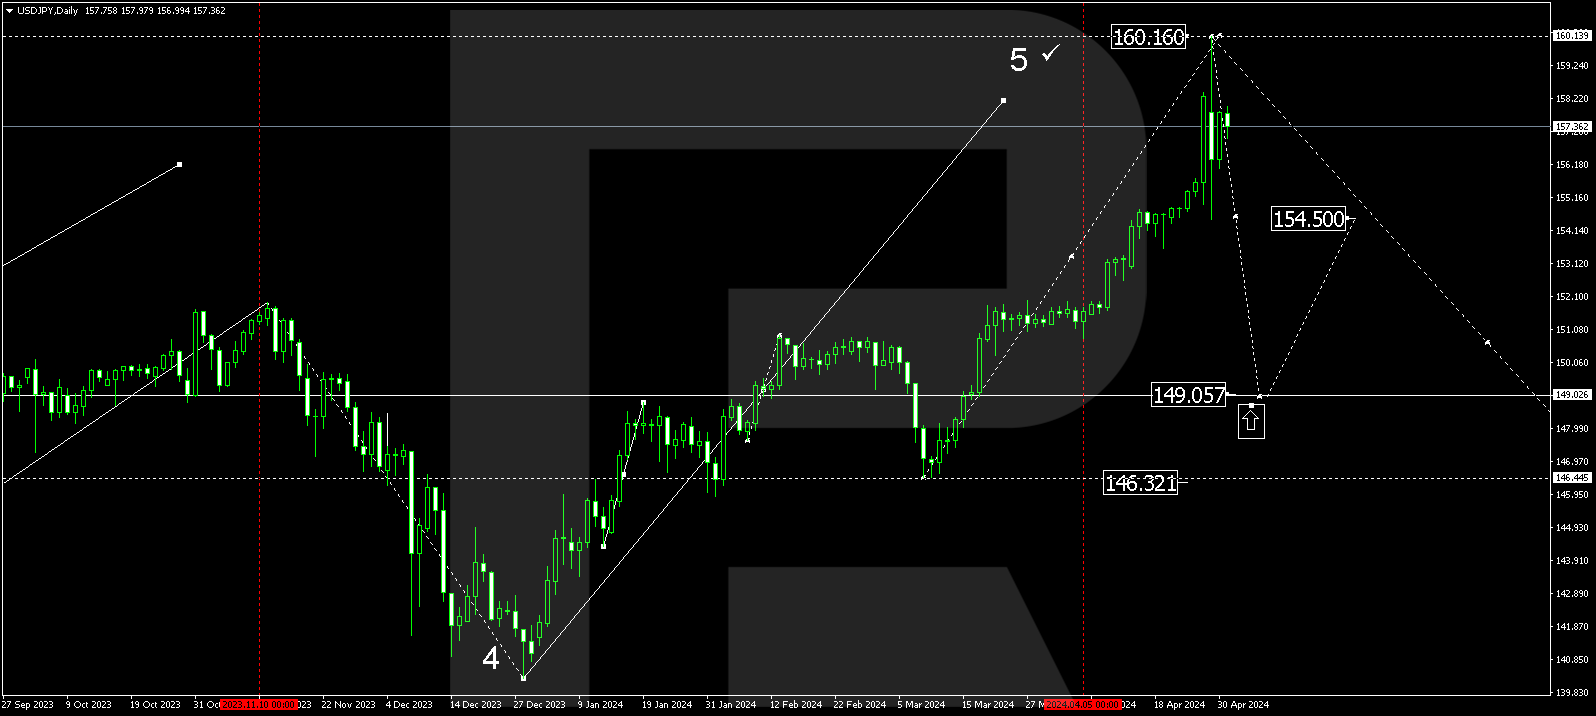
USDJPY, “US Dollar vs. Japanese Yen”
As we can see in the daily chart, USDJPY is forming a wave to the upside; it has already broken the post-correctional extension area between 138.2% and 161.8% fibo at 112.78 and 113.47 respectively and is currently heading towards 261.8% fibo at 116.40. The support is still the local low at 108.72.
The H4 chart shows divergence on MACD, which may indicate a possible descending correction soon towards 23.6%, 38.2%, and 50.0% fibo at 113.20, 112.42, and 111.78 respectively. The key resistance here is the high at 114.46.
