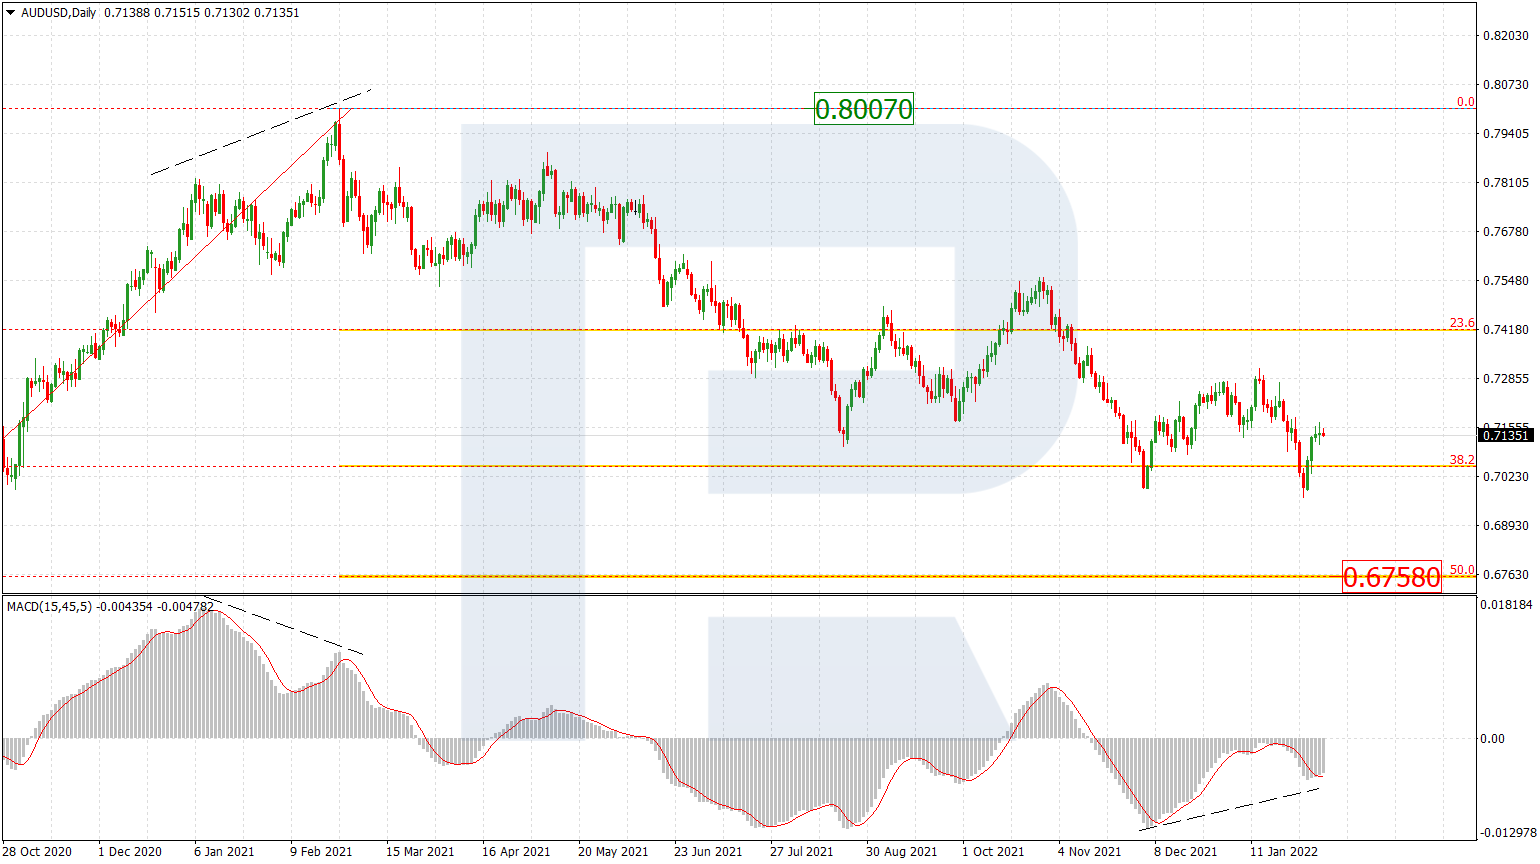
AUDUSD, “Australian Dollar vs US Dollar”
In the daily chart, the asset is forming a quick descending wave inside the downtrend. After testing 23.6% fibo from below, AUDUSD is approaching 38.2% at 0.7052 and may later continue trading towards 50.0% and 61.8% fibo at 0.6758 and 0.6464 respectively. The key resistance is the high at 0.8007.


The H1 chart of AUDUSD shows divergence on MACD, which may indicate a potential correctional rebound after the price 38.2% fibo at 0.7052. the correctional targets may be 23,6%, 38.2%, and 50.0% at 0.7141, 0.7195, and 0.7239 respectively.


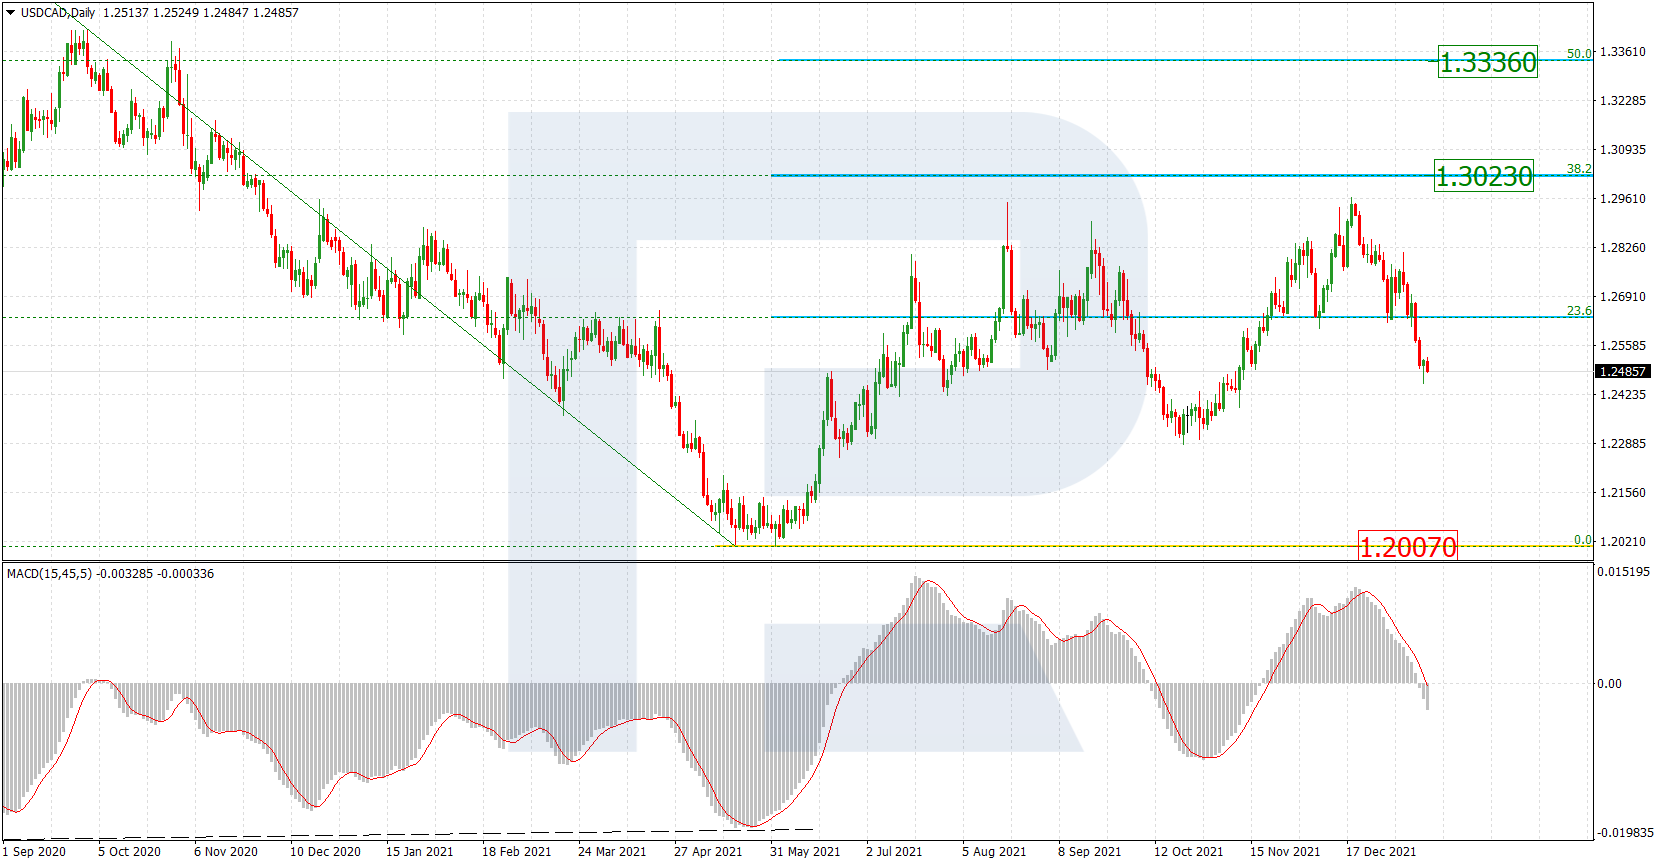
USDCAD, “US Dollar vs Canadian Dollar”
As we can see in the daily chart, the pair is moving upwards, thus forming a new wave to the upside with the targets at 38.2%, 50.0%, and 61.8% fibo at 1.3022, 1.3336, and 1.3650 respectively. The key support remains at the low at 1.2007.


In the H4 chart, after completing the descending correction at 50.0% fibo, the asset has broken its previous high. At the moment, the pair is trading towards the post-correctional extension area between 138.2% and 161.8% fibo at 1.2953 and 1.3044 respectively. The support is the fractal low at 1.2422.

