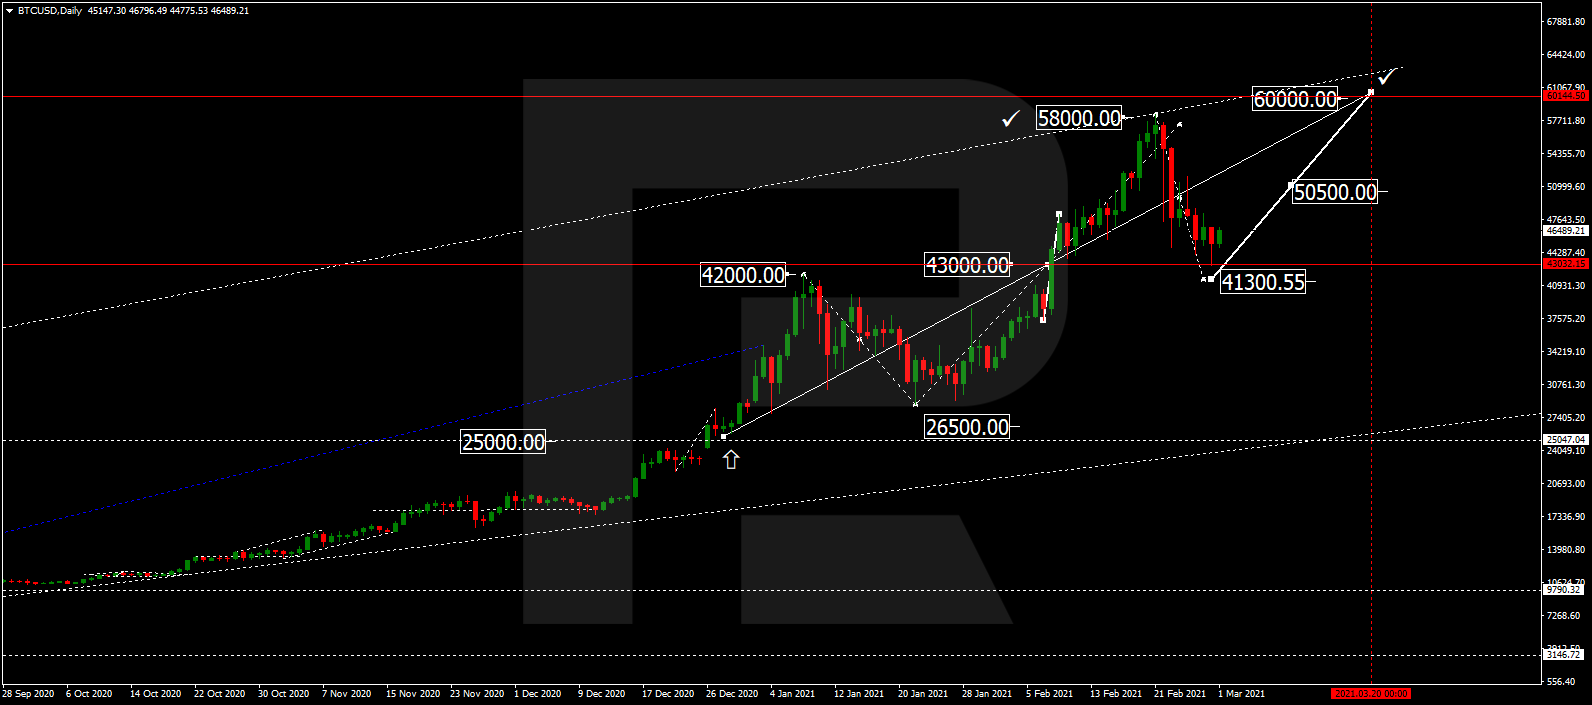
BTCUSD, “Bitcoin vs US Dollar”
The daily chart shows a quick and steady growth towards the al-time high. After breaking the fractal at 13857.20, BTCUSD is heading towards the post-correctional extension area between 138.2% and 161.8% fibo at 17660.00 and 20000.00 respectively. If the asset decides to start a new pullback, its target will be at 13857.20, which now acts as the support.

As we can see in the H1 chart, the pair is correcting after a local divergence on MACD and has already tested 38.2% fibo several times. However, judging by a consolidation channel, the price intends to break the high at 18495.50 and then continue moving upwards. Still, the asset may yet rebound from the local high and start a descending correction towards 50.0% and 61.8% fibo at 17142.5, and 16827.00 respectively.

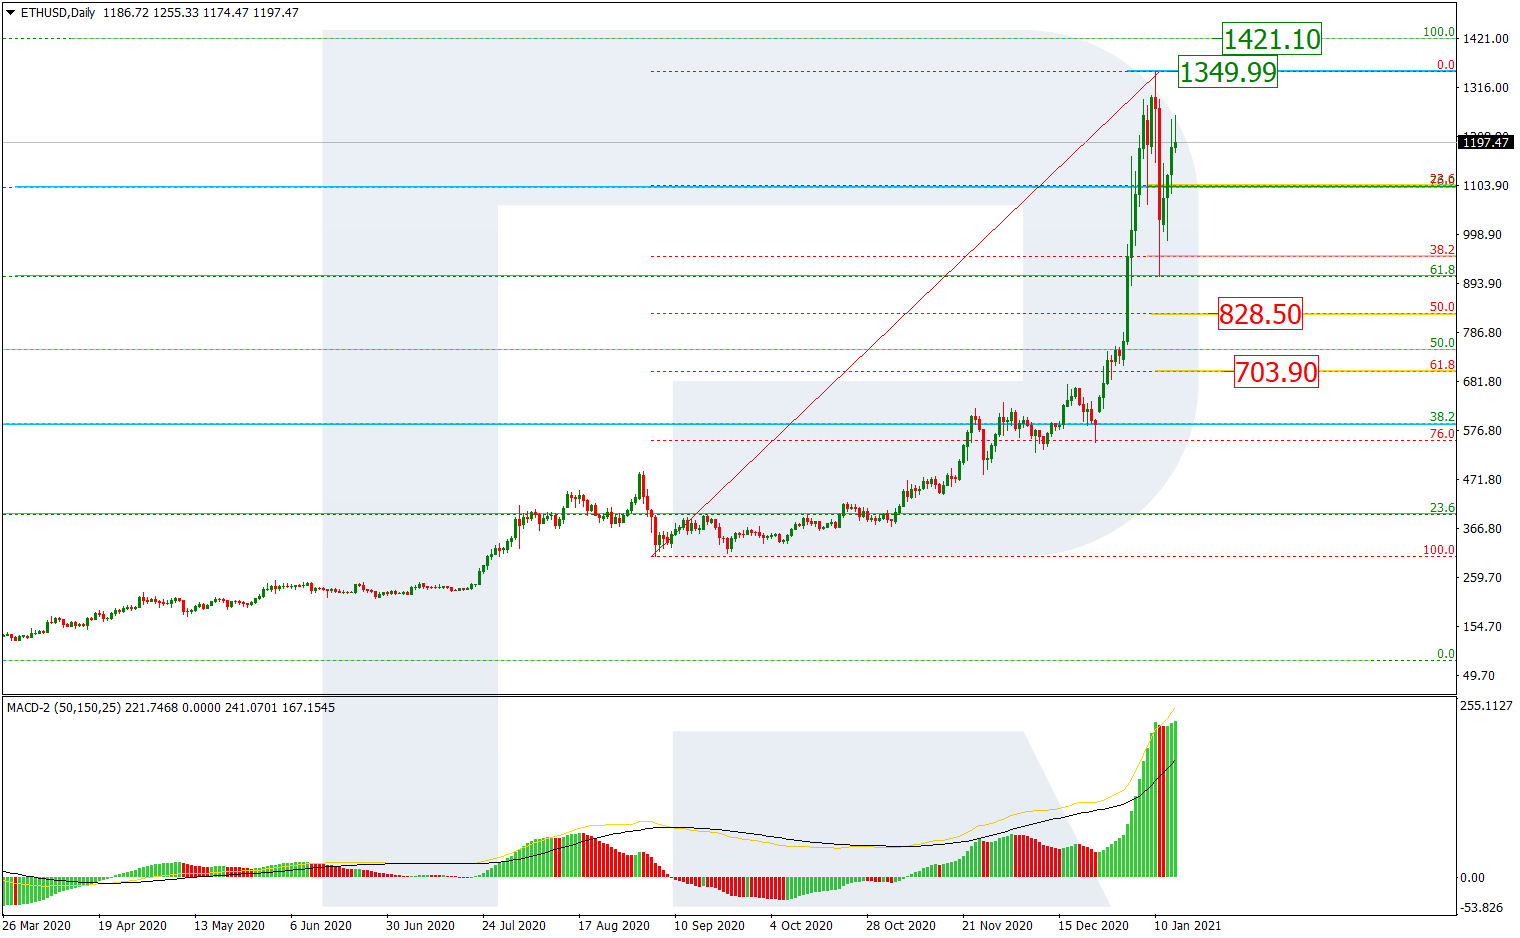
ETHUSD, “Ethereum vs. US Dollar”
The daily chart shows a breakout of a test of the long-term fractal high at 488.68. If the price fixes above this level, it may continue the ascending tendency towards the post-correctional extension area between 138.2% and 161.8% fibo at 558.50 and 601.65 respectively with the long-term 38.2% fibo (592.36) inside it. The support is the fractal low at 305.42.
As we can see in the H1 chart, the ascending tendency continues but there is a divergence on MACD. In this case, the pair may start a new pullback to return to 76.0% fibo at 444.55.
