EURUSD, “Euro vs US Dollar”
As we can see in the H4 chart, the correctional downtrend has reached 38.2% fibo. The next downside targets may be 50.0% and 61.8% at 1.1059 and 1.1017 respectively. At the same time, there is a convergence on MACD, which may indicate the trend reverse. If it happens, the next rising wave will be heading towards the local high at 1.1239 and then mid-term 76.0% fibo at 1.1284.


In the H1 chart, the convergence made the pair reverse and start a new ascending impulse, which has reached 23.6% fibo. The next upside targets may be 38.2% and 50.0% fibo at 1.1114 and 1.1125 respectively. The support is the local low at 1.1077.

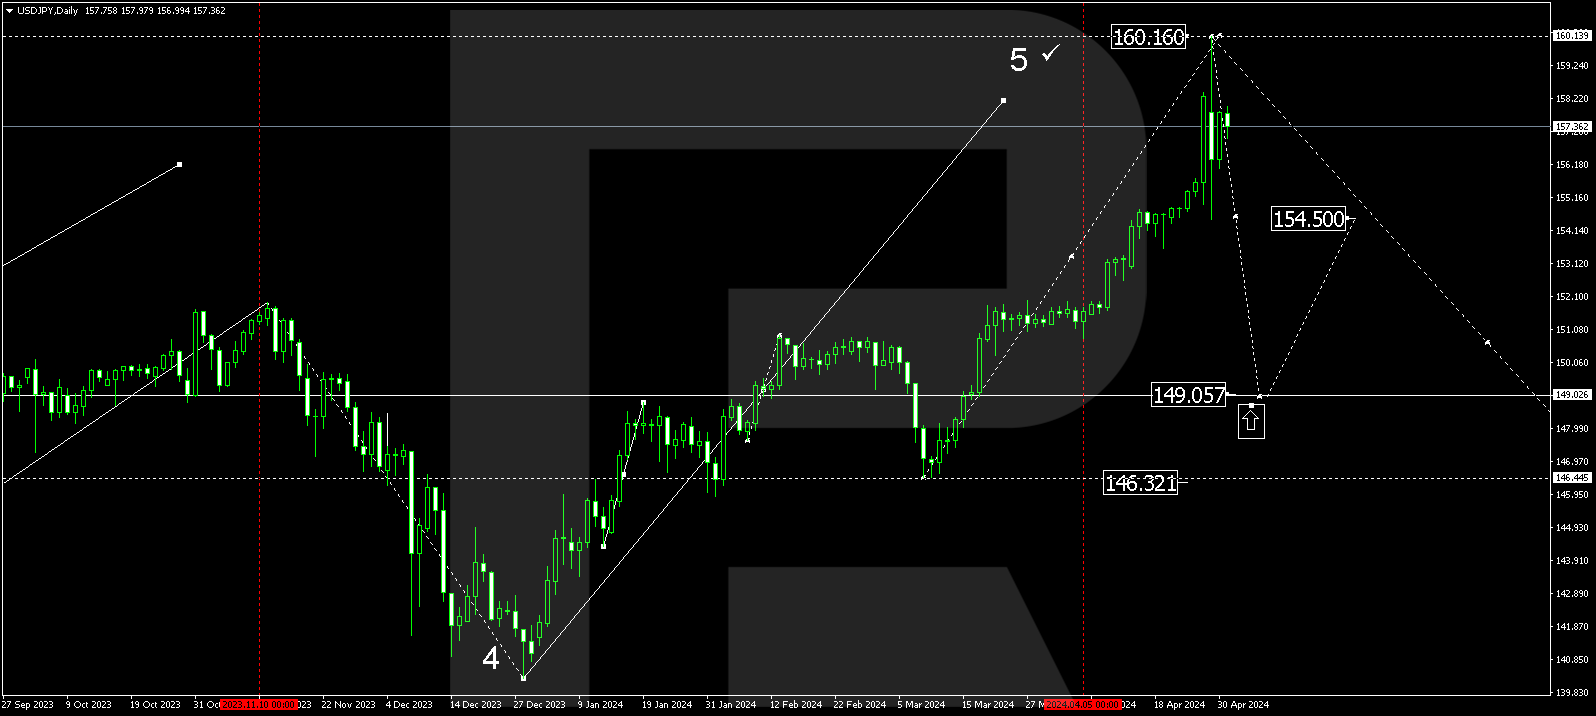
USDJPY, “US Dollar vs. Japanese Yen”
As we can see in the daily chart, USDJPY is getting close to mid-term 76.0% fibo at 110.49. if the price breaks this level, it may continue growing towards the fractal high at 112.40. The support is 50.0% fibo at 108.43. At the same time, there is a divergence on MACD, which may force a short-term pullback.
In the H1 chart, the divergence on MACD made the pair start a new correction to the downside. The targets are 23.6%, 38.2%, and 50.0% fibo at 109.67, 109.28, and 108.97 respectively. The resistance is the high at 110.29.
