AUDUSD, “Australian Dollar vs US Dollar”
As we can see in the H4 chart, AUDUSD is forming a new local correction after a divergence on MACD. The current rising impulse is heading towards the high at 0.7820, a breakout of which will lead to a further growth to reach the long-term 50.0% fibo at 0.8292. However, if the price rebounds from the high, the asset may resume falling to reach 23.6%, 38.2%, and 50.0% fibo at 0.7625, 0.7503, and 0.7405 respectively.


The H1 chart shows that the current ascending movement has already broken 61.8% fibo and is getting close to 76.0% fibo at 0.7781. If the price grows and breaks the high, the asset may continue trading upwards to reach the post-correctional extension area between 138.2% and 161.8% fibo at 0.7881 and 0.7919 respectively. The support is at 0.7659, a breakout of which may hint at a new mid-term decline.

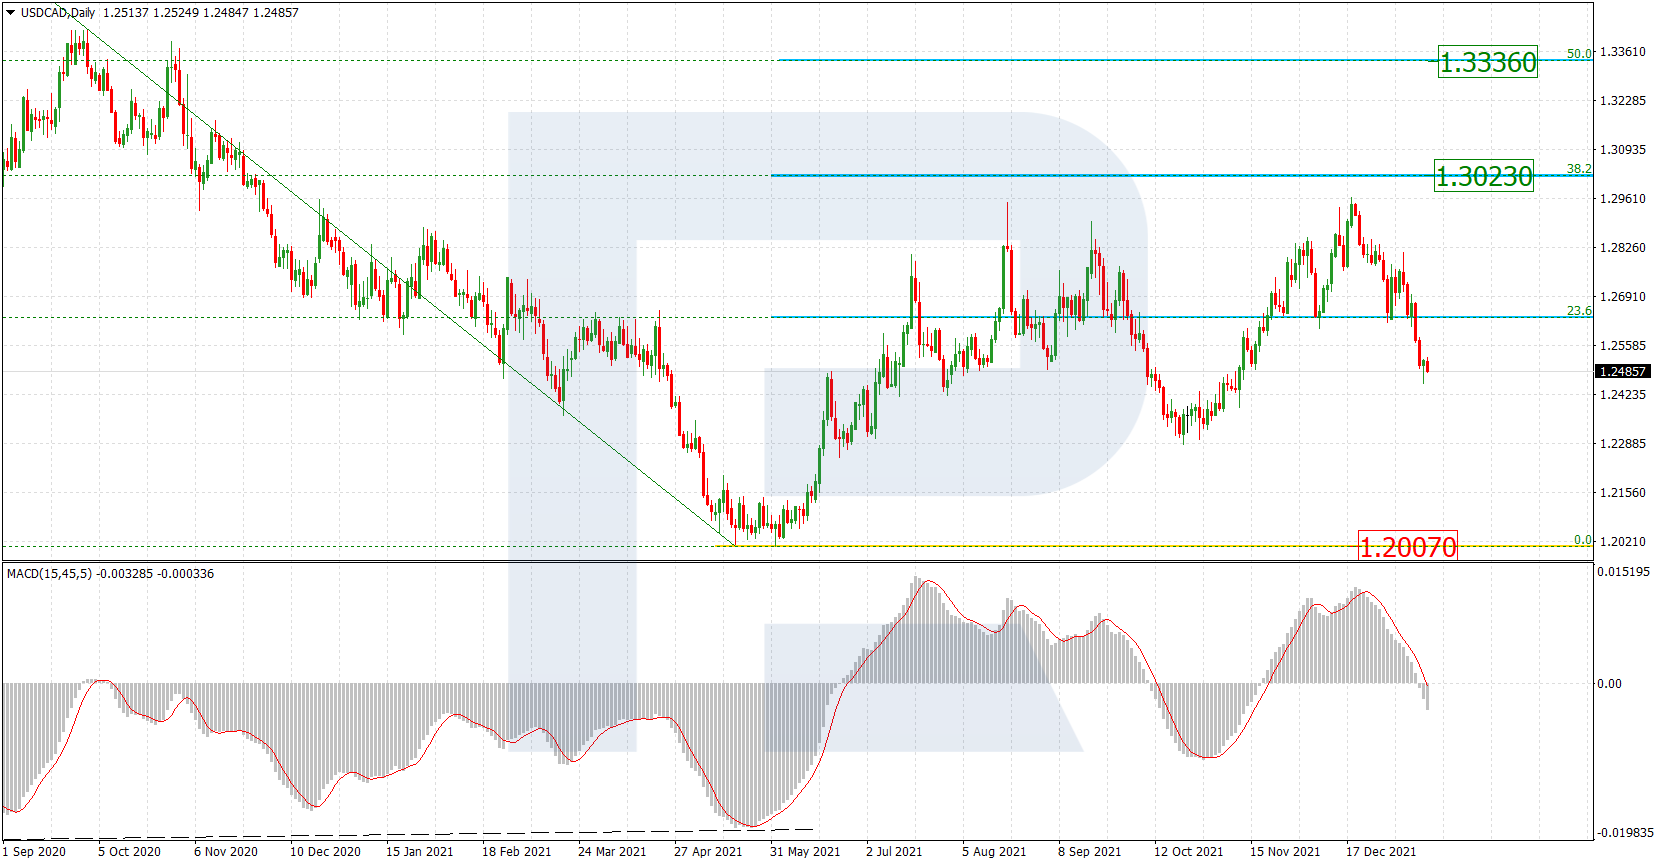
USDCAD, “US Dollar vs Canadian Dollar”
As we can see in the daily chart, after a thorough test of 76.0% fibo, USDCAD is breaking this level. In this case, the next downside target may be close to the fractal low at 1.2061. At the same time, there is a convergence on MACD, which may hint at a new pullback towards the resistance at 61.8% fibo (1.3057).
In the H4 chart, after breaking the low at 1.2688, the pair is falling towards the local post-correctional extension area between 138.2% and 161.8% fibo at 1.2585 and 1.2523 respectively. The local resistance is at 1.2957.
