Fibonacci Retracements Analysis 21.02.2020 (BITCOIN, ETHEREUM)
As we can see in the H4 chart, the divergence made BTCUSD stop rising at 50.0% fibo and start a new decline towards the support, which is close to 38.2% fibo at 9263.40. After completing the correction, the instrument may start a new rising impulse towards 61.8% and 76.0% fibo at 11010.00 and 12074.00 respectively.


The H1 chart shows more detailed structure of the current decline after the divergence. The pair has already corrected to the downside by 50.0%. The next targets are 61.8% and 76.0% fibo at 9090.00 and 8765.00 respectively. The resistance is the high at 10505.60.


ETHUSD, “Ethereum vs. US Dollar”
As we can see in the daily chart, after reaching 61.8% fibo, ETHUSD is forming a triangle correction. After completing it, the instrument may grow towards 76.0% fibo at 304.00. The support is 38.2% fibo at 210.34.


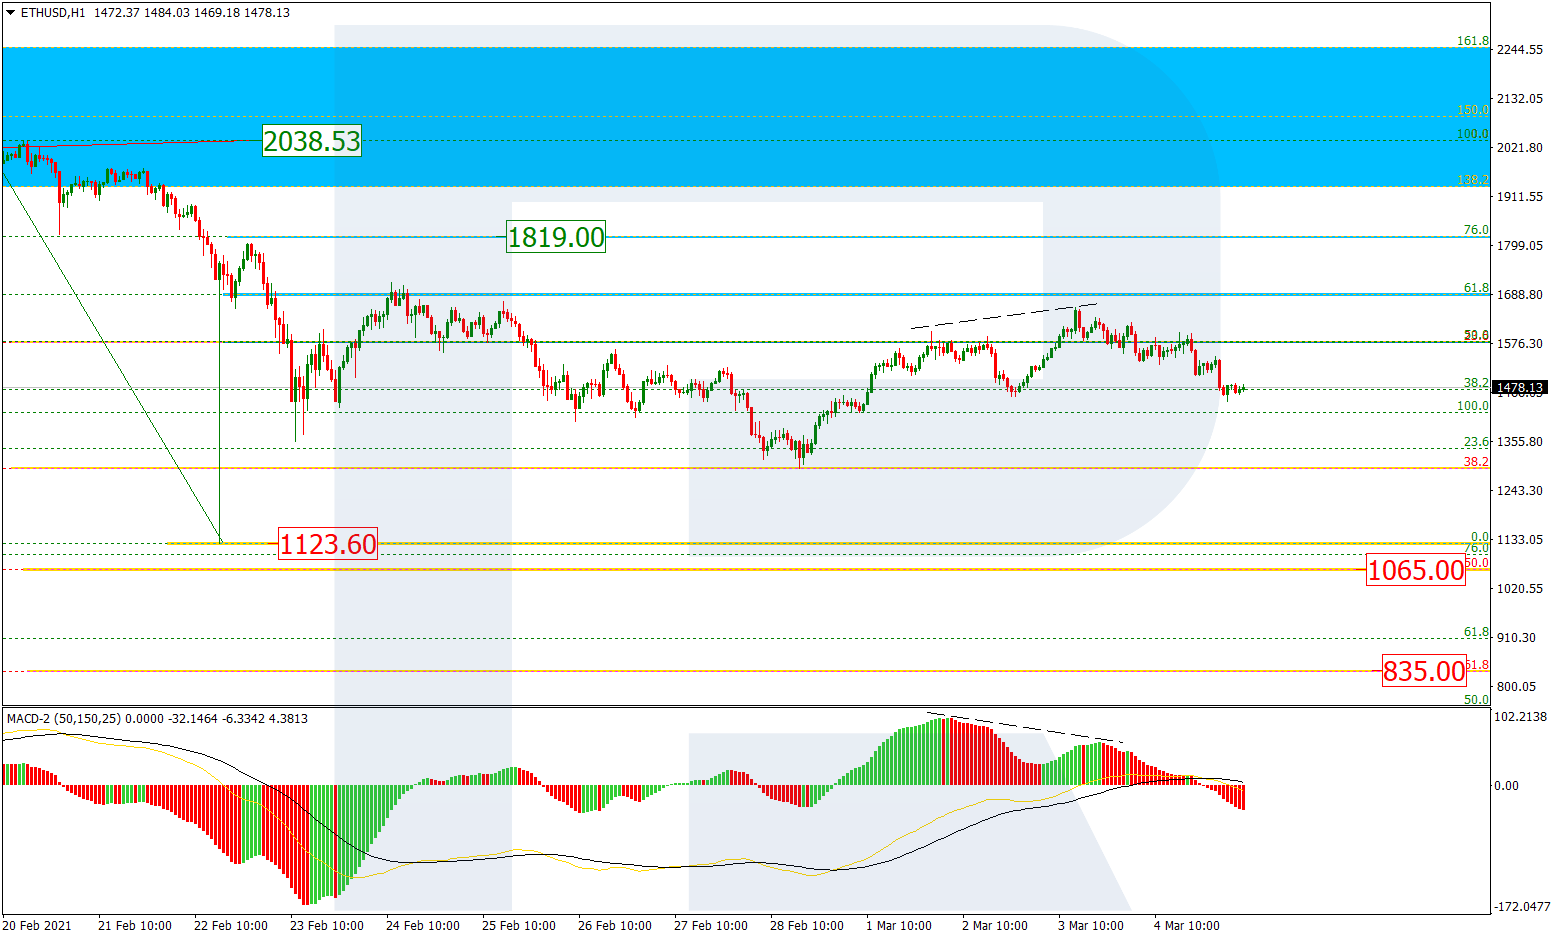
The H1 chart shows that the first descending impulse after the divergence has reached 38.2% fibo. If the pair breaks the downside border of a Triangle pattern, the instrument may fall towards 50.0% and 61.8% fibo at 222.22 and 206.61 respectively. The resistance is the high at 288.98.

