GBPUSD, “Great Britain Pound vs US Dollar”
As we can see in the H4 chart, another descending wave has broken the retracement of 61.8% and may continue trading downwards. The next target is the retracement of 76.0% at 1.2633. in the nearest future, the instrument may start a new pullback after the convergence.


In the H1 chart, the convergence made the pair start the first rising impulse, which has already reached the retracement of 23.6%. The next impulse will be heading towards the retracements of 38.2% and 50.0% at 1.2873 and 1.2930 respectively. After breaking the local low at 1.2685, the instrument will complete the correction.

EURJPY, “Euro vs. Japanese Yen”
As we can see in the H4 chart, EURJPY is still trading downwards; it reached the retracement of 50.0% and the next target may be the retracement of 61.8% at 121.61. At the same time, there was a convergence on MACD, which indicated a correctional uptrend. By now, it has already reached the retracement of 23.6% and may continue towards 38.2% and 50.0% at 123.89 and 124.45 respectively. The support level is at 122.08.

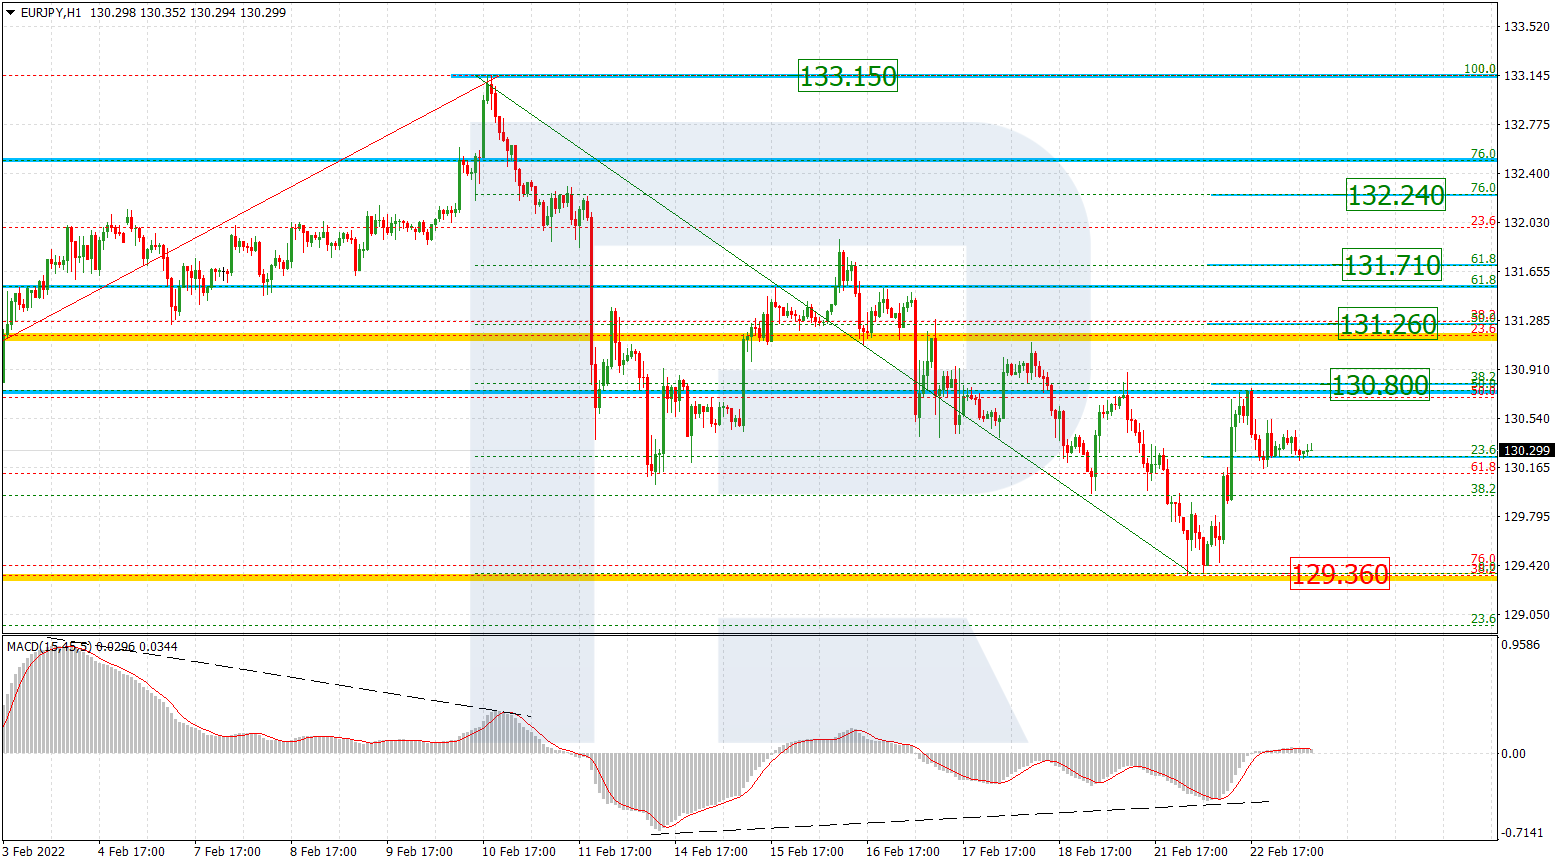
The H1 chart shows more detailed structure of the current rising correctional tendency.