Brent
In the daily chart, divergence on MACD made the asset start a new bearish phase; the first descending wave is heading towards 23.6% at 62.90, while the next ones may later reach 38.2%, 50.0%, and 61.8% fibo at 53.90, 46.60, and 39.40 respectively. The resistance is the high at 77.47, a breakout of which may lead to a further uptrend towards the long-term high at 87.09. The current movement to the upside should be considered as a pullback after a quick decline, which may later be followed by another descending structure.


As we can see in the H1 chart, the asset is correcting upwards; it has already reached 50.0% and may later continue towards 61.8% and 76.0% fibo at 72.89 and 74.12 respectively. The local resistance is at 76.23, while the support is the low at 67.46, which is also the key target of the next descending wave.


Dow Jones
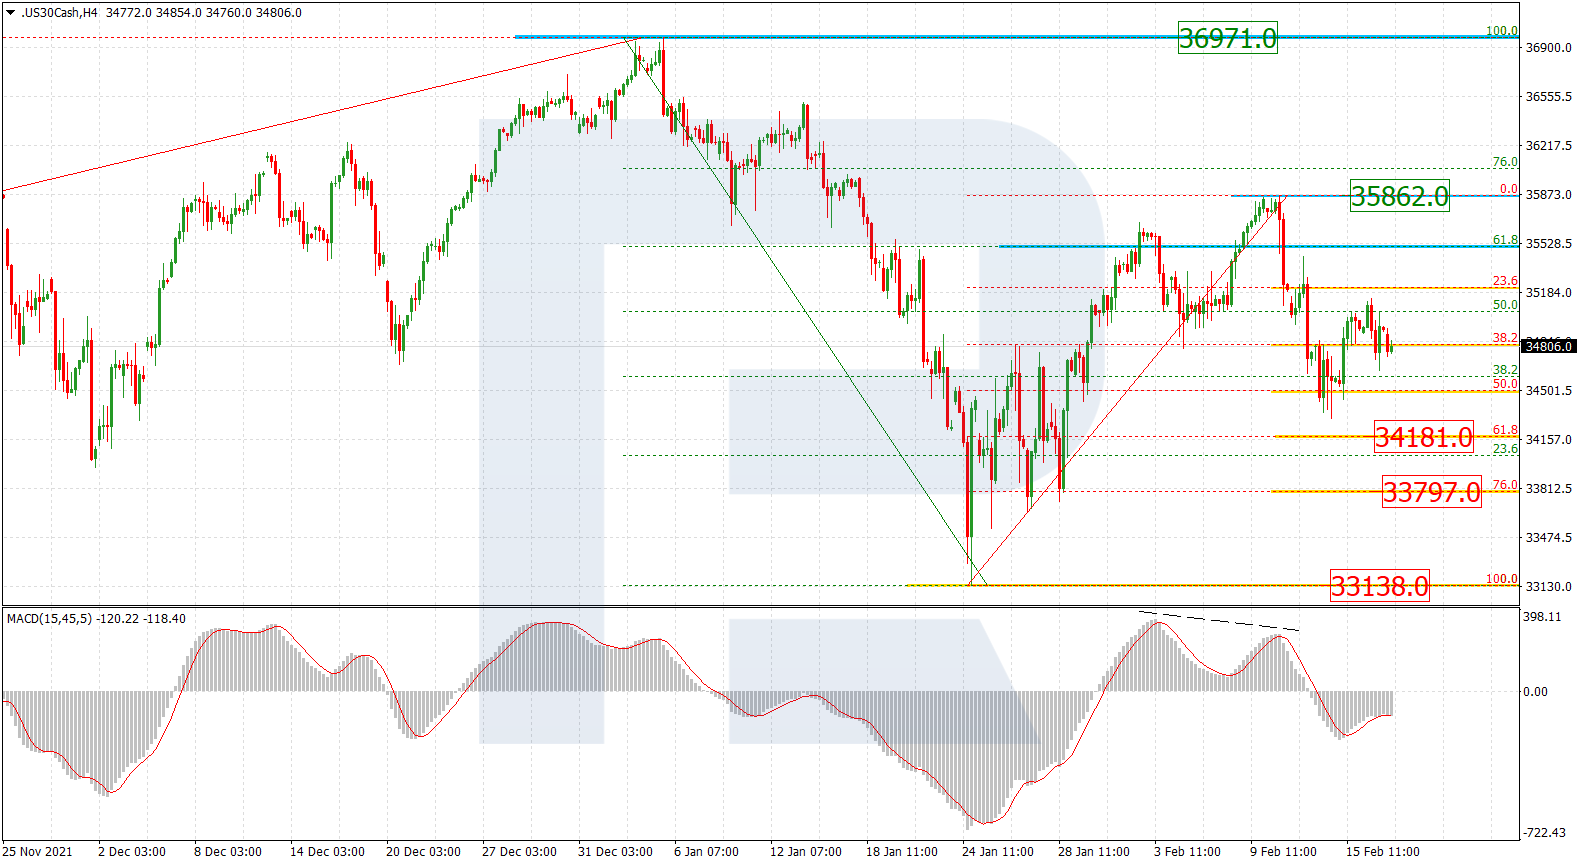
As we can see in the H4 chart, the situation hasn’t changed much. Divergence made the asset complete the correction and start a new growth towards the high 35102.0, a breakout of which may lead to a further uptrend towards the post-correctional extension area between 138.2% and 161.8% fibo at 35890.0 and 36378.0 respectively. The support is at 33035.0.


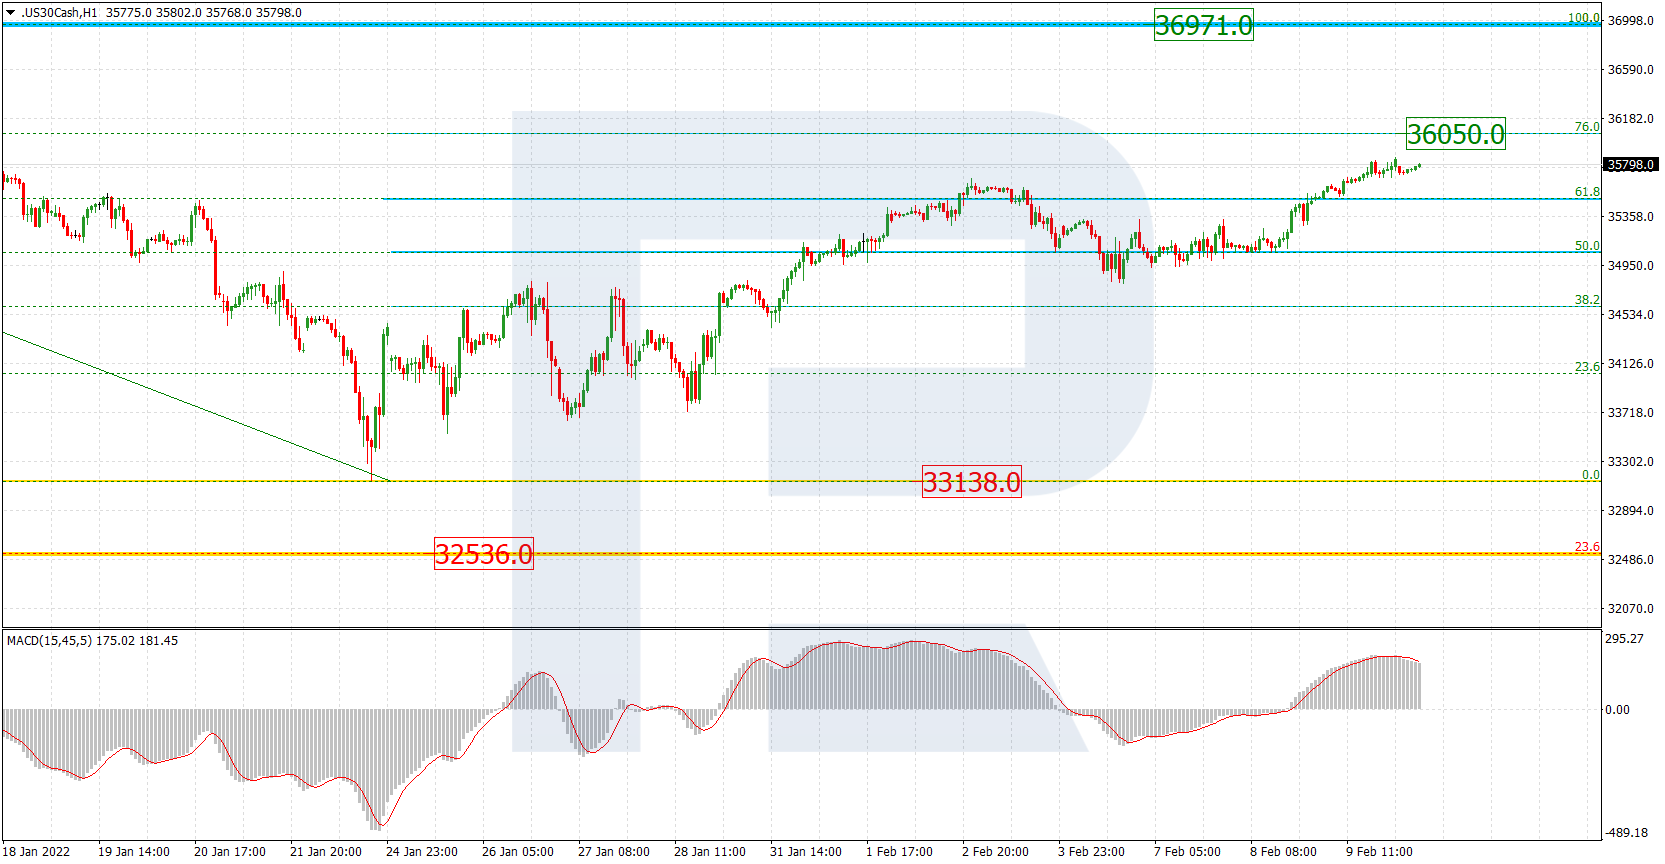
In the H1 chart, the asset is moving upwards and has already broken 76.0% fibo. Later, the instrument may break the local high at 35098.0, as well as the key one at 35102.0. The support is the low at 33744.0.

