GBP USD, “Great Britain Pound vs US Dollar”
At the H4 chart, the GBP/USD pair is forming the local flat pattern, which may indicate a slight correction within the downtrend. It is worthy of note that this movement matches the pullback by 38.2% of the previous five months’ uptrend and the pullback by 61.8% of the previous two months’ ascending impulse. The next targets of the current downtrend may be the retracements of 76.0% and 50.0% at 1.2754 and 1.2689 respectively. At the same time, we can see that the price is forming the divergence, which means that after reaching its target levels, the instrument may reverse or start forming a new ascending impulse.

As we can see at the H1 chart, the pair has completed the descending impulse and formed the convergence. The correction has reached the retracement of 38.2%. After breaking the local low at 1.2844, the price may continue falling. The targets are the same as at the H4 chart.

EUR JPY, “Euro vs. Japanese Yen”
As we can see at the H4 chart, the EUR/JPY pair has reached a new local low while forming the current descending impulse, but hasn’t reached the post-correctional extension area between the retracements of 138.2% – 161.8% (126.89 – 126.58). It is worthy of note that the upside border of this range matches the pullback by 50.0% of the uptrend that started in June.

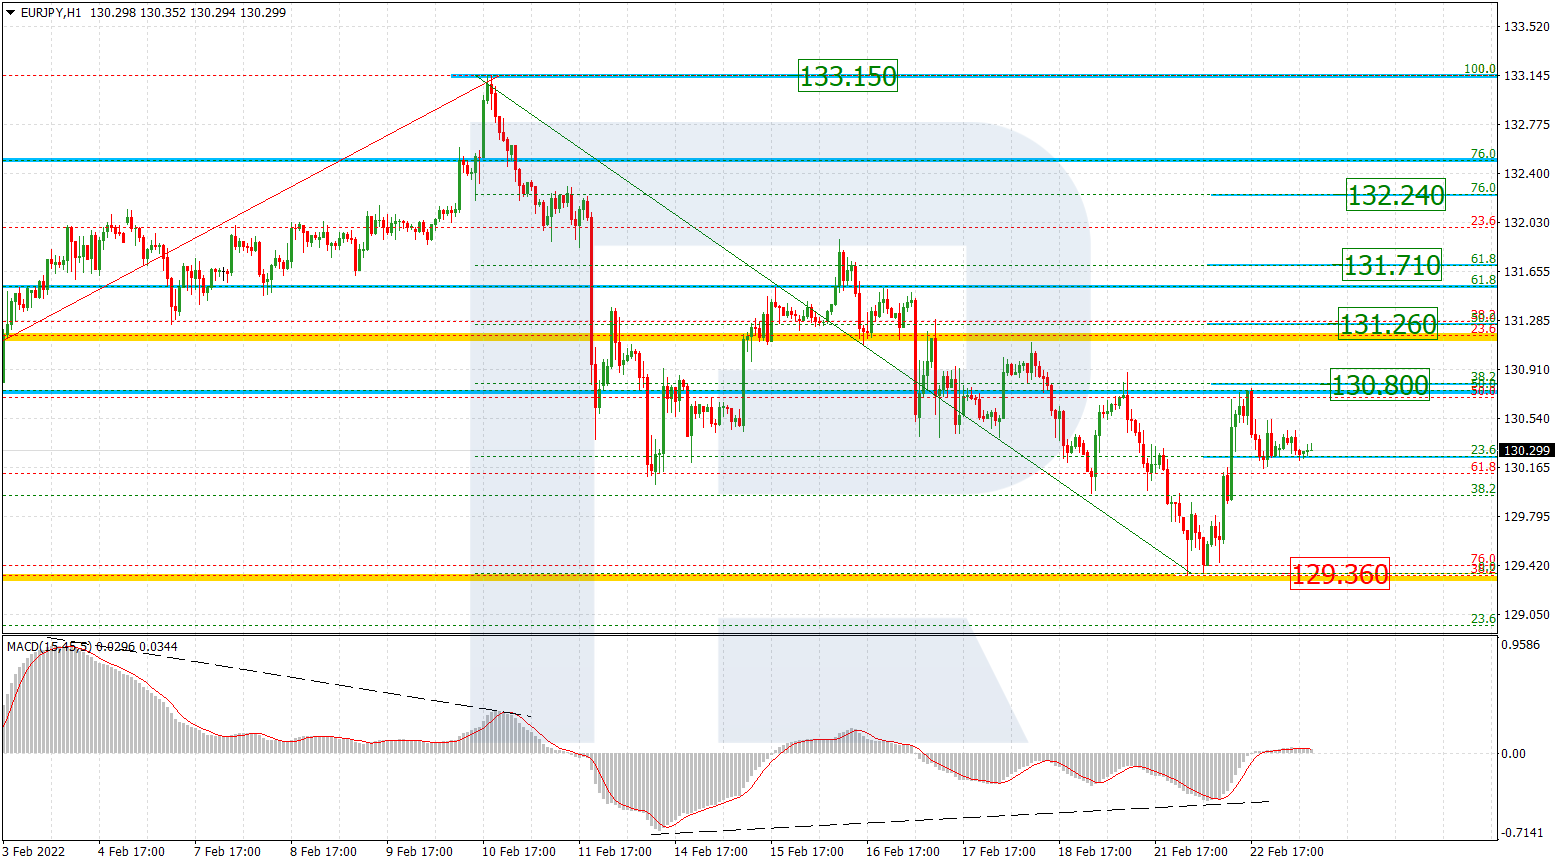
At the H1 chart, the pair is correcting the previous descending impulse. By now, the correction has already reached the retracement of 38.2%. The next target of this correction is the retracement of 50.0% at 129.47.
RoboForex Analytical Department