GBPUSD, “Great Britain Pound vs US Dollar”
As we can see in the H4 chart, there was a convergence on MACD that made GBPUSD start a new correctional uptrend, which has already reached the retracement of 23.6%. In the future, the correction may continue towards the retracements of 38.2% and 50.0% at 1.3153 and 1.3386 respectively. At the same time, there is divergence on MACD, which may indicate a possible short-term pullback. The key support level is at 1.2397.


In the H1 chart, the pair has been corrected to the downside by 23.6%. If a new rising impulse fails to break the current high at 1.3000, the price may start a new descending wave towards the retracements of 38.2%, 50.0%, and 61.8% at 1.2770, 1.2699, and 1.2628 respectively.

EURJPY, “Euro vs. Japanese Yen”
As we can see in the H4 chart, EURJPY is trading sideways between the retracements of 38.2% and 50.0%, but hasn’t reached the latter level yet. After breaking it, the instrument may continue growing towards the retracement of 61.8% at 127.34. The support level is still at 121.55.

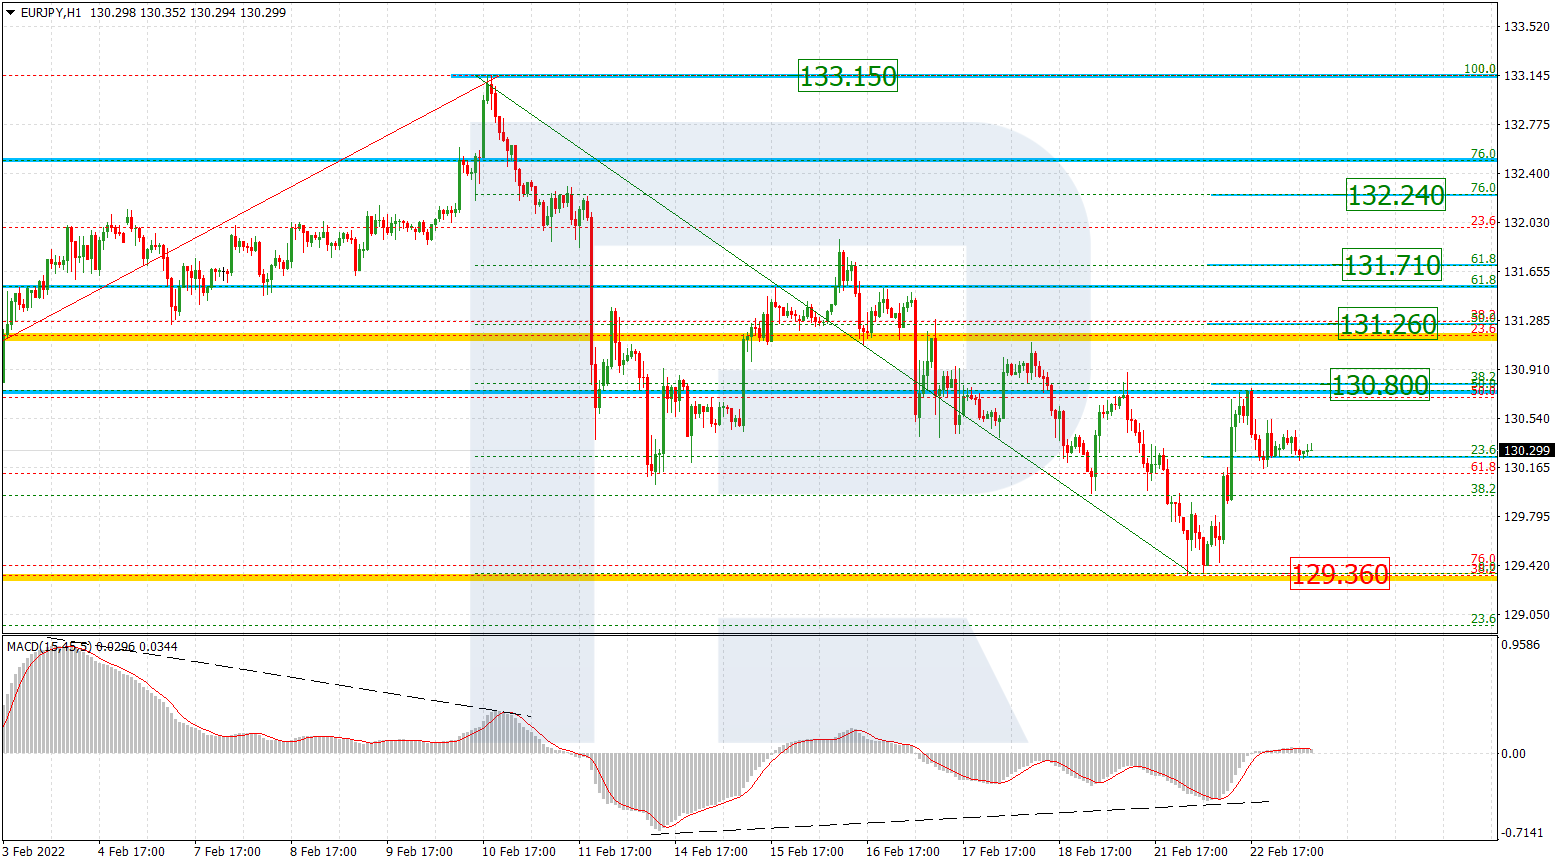
In the H1 chart, the pair is being corrected to the downside and has already reached the retracement of 23.6%. The next possible targets of this correction may be the retracement of 38.2% at 122.37. The local resistance is at 125.09.