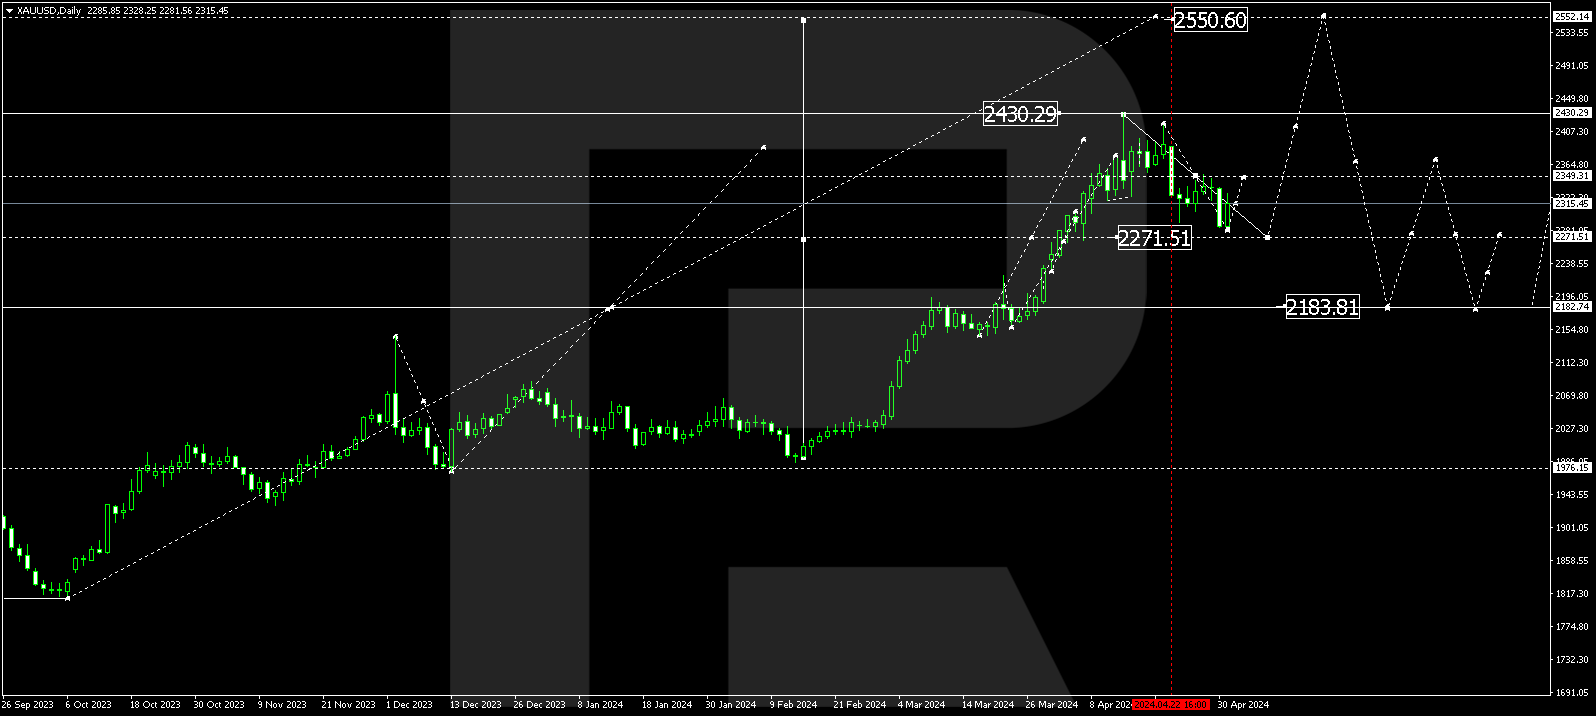
XAUUSD, “Gold vs US Dollar”
As we can see in the daily chart, the divergence made the pair form a new wave to the downside; the wave broke 38.2% fibo but later stopped not fare from 50.0% fibo at 1431.95. After finishing the correction, XAUUSD may resume trading downwards to reach 50.0% and 61.8% fibo at 1431.95 and 1367.80 respectively. The resistance is the high at 1703.17.

In the H4 chart, the first rising impulse has corrected the previous descending wave by 38.2%. Later, the pair may continue growing towards 50.0% fibo at 1578.10. After completing the pullback and breaking the low at 1451.18, the price may continue its mid-term descending tendency.

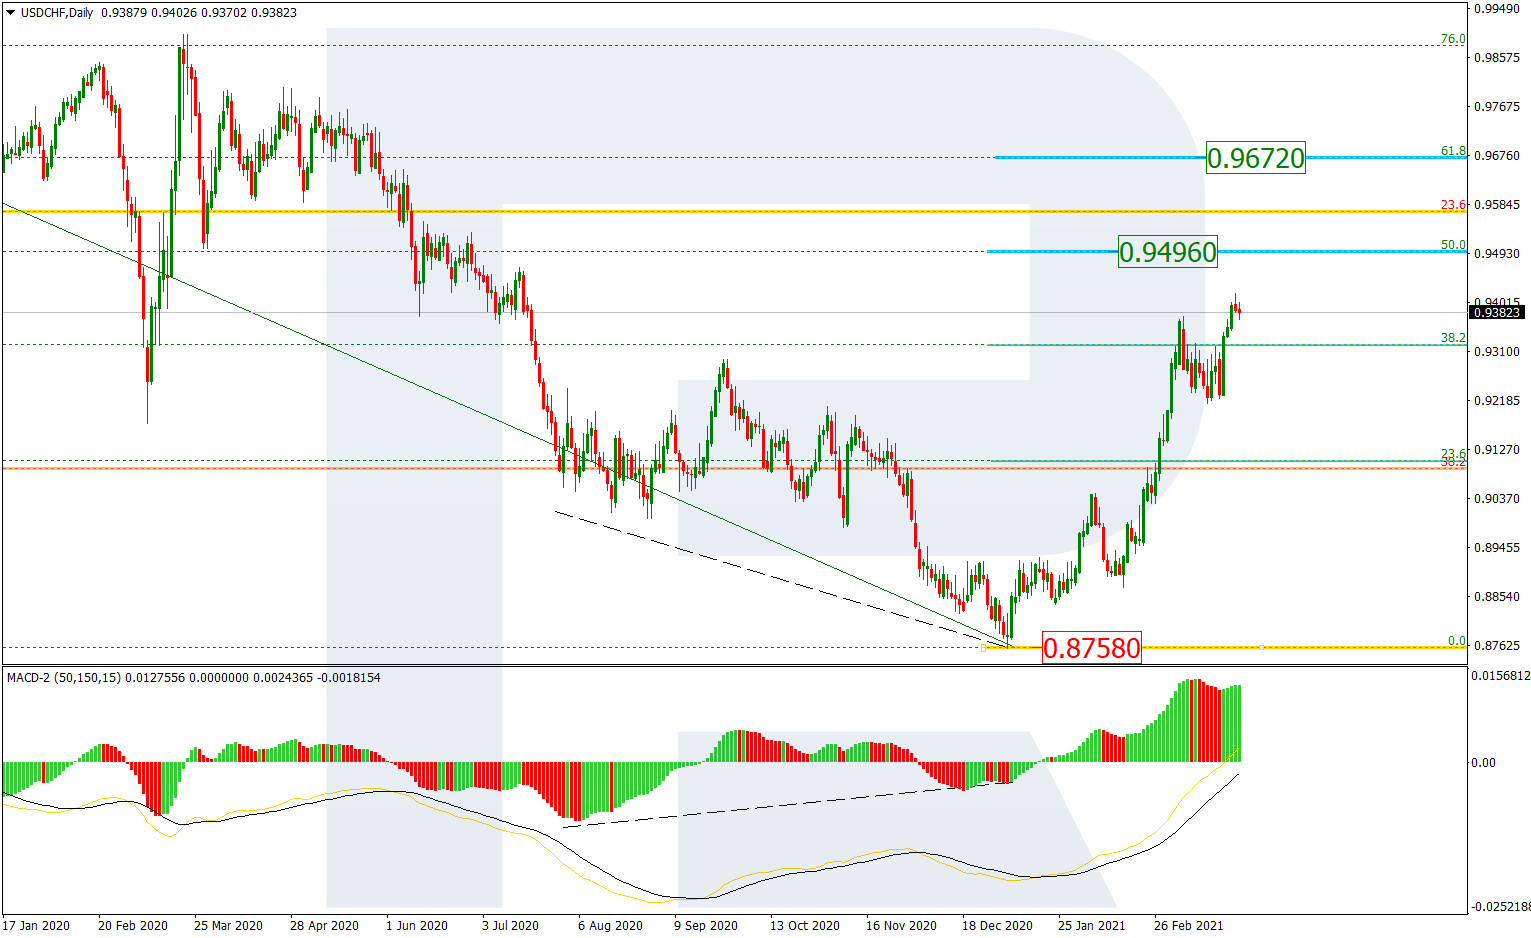
USDCHF, “US Dollar vs Swiss Franc”
In the daily chart, the rising impulse has completely corrected the previous descending wave, which means that the pair may continue growing towards 76.0% fibo at 0.9982 and the fractal high at 1.0236. In the mid-term, USDCHF is expected to trade between 0.9176 and 1.0236.
In the H1 chart, we can see a local divergence and a new pullback. The descending wave may be heading towards 23.6%, 38.2%, and 50.0% fibo at 0.9730, 0.9624, and 0.9538 respectively. The resistance is at 0.9901.
