GBP USD, “Great Britain Pound vs US Dollar”
As we can see at the H4 chart, the previous mid-term uptrend has been corrected by 382%. Later, the current descending correction may continue after breaking the local low at 1.3030. The next targets may be inside the post-correctional extension area between the retracements of 138.2% and 161.8% at 1.2906 and 1.2837 respectively.

At the H1 chart, the pair is forming the short-term correction to the upside, which has already reached the retracement of 50.0%. After completing the correction, the instrument may start a new descending impulse to continue the mid-term downtrend. If the price breaks the local low at 1.3087, it will continue moving toward the post-correctional extension area between the retracements of 138.2% and 161.8% at 1.3035 and 1.3000 respectively.

EUR JPY, “Euro vs. Japanese Yen”
As we can see at the H4 chart, the EUR/JPY pair is still moving sideways and may soon break the current high at 134.37. In this case, the price may move towards the post-correctional extension area between the retracements of 138.2% and 161.8% at 135.43 and 136.07 respectively.

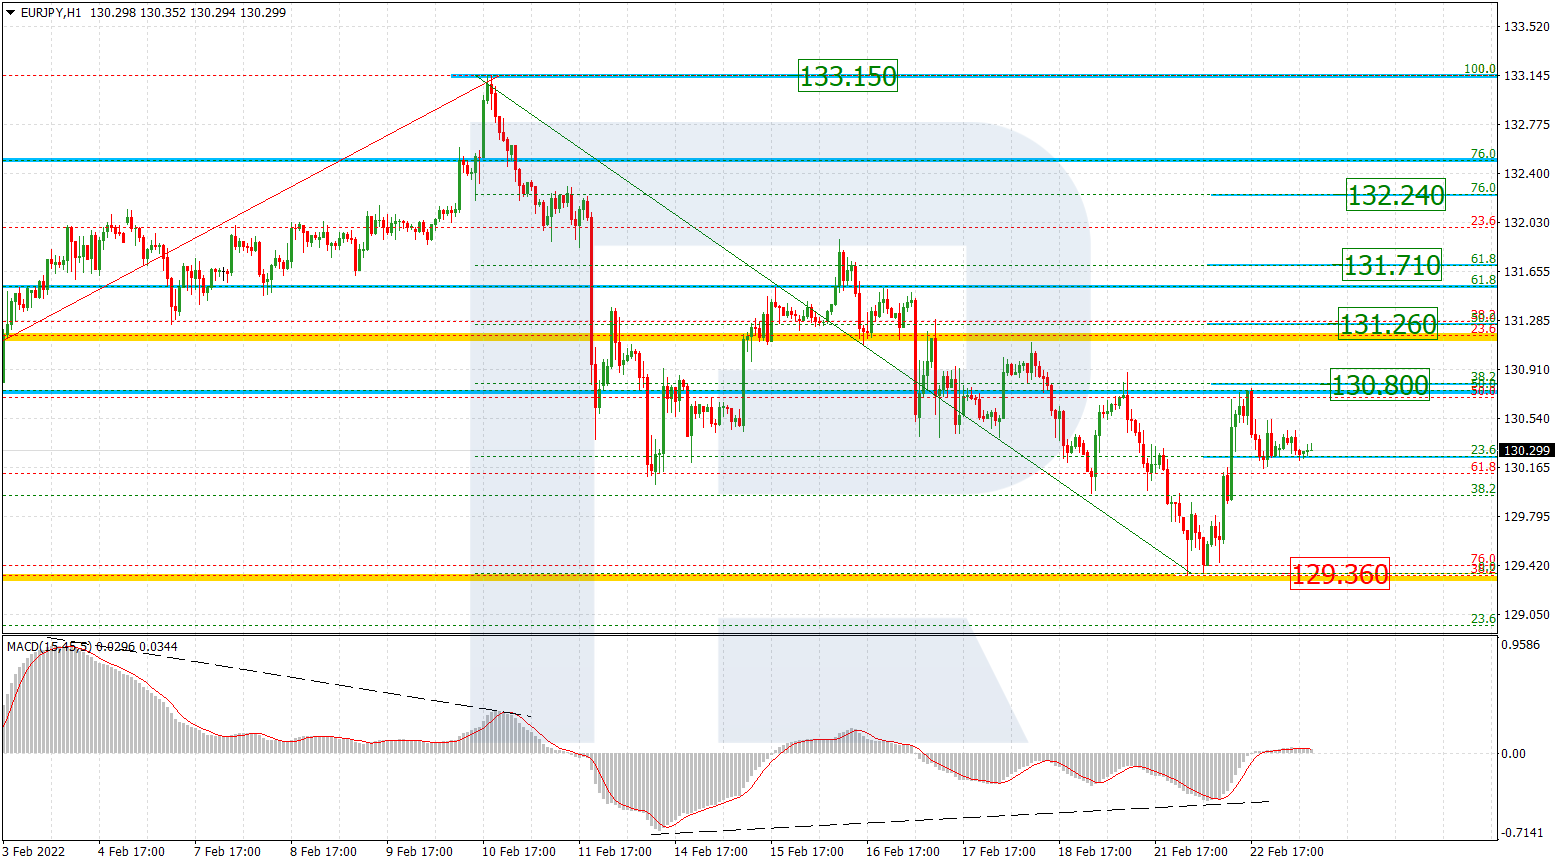
At the H1 chart, the divergence is being formed, which may indicate a possible descending movement. This possible decline may be considered as the correction of the previous ascending impulse. The targets of this correction may be the retracement of 23.6%, 38.2%, and 50.0% at 133.54, 133.18, and 132.89 respectively. The resistance level is close to the local high at 134.13.
RoboForex Analytical Department