GBPUSD, “Great Britain Pound vs US Dollar”
As we can see in the H4 chart, there was a divergence on MACD, which made the pair start a new descending tendency after reaching 50.0% fibo. GBPUSD is slowly falling to reach 23.6% fibo, but a local ascending impulse hints at a new growth towards the high at 1.2518 and then mid-term 61.8% fibo at 1.2710. However, the key scenario implies further decline towards 38.2%, 50.0%, and 61.8% fibo at 1.2344, 1.2270, and 1.2197 respectively.


In the H1 chart, the pair is forming a new short-term correction after finishing another descending impulse. By now, the pullback has already reached 50.0% fibo and may yet continue towards 61.8% fibo at 1.2517. If the price breaks the local low at 1.2412, the mid-term decline may continue.

EURJPY, “Euro vs. Japanese Yen”
As we can see in the H4 chart, after completing the correctional uptrend at 50.0% fibo, EURJPY is quickly trading downwards. By now, it has already reached 50.0% fibo. After finishing a short-term correction, the price may continue falling towards 61.8% and 76.0% fibo at 117.45 and 116.86 respectively. The key support is the low at 115.86.

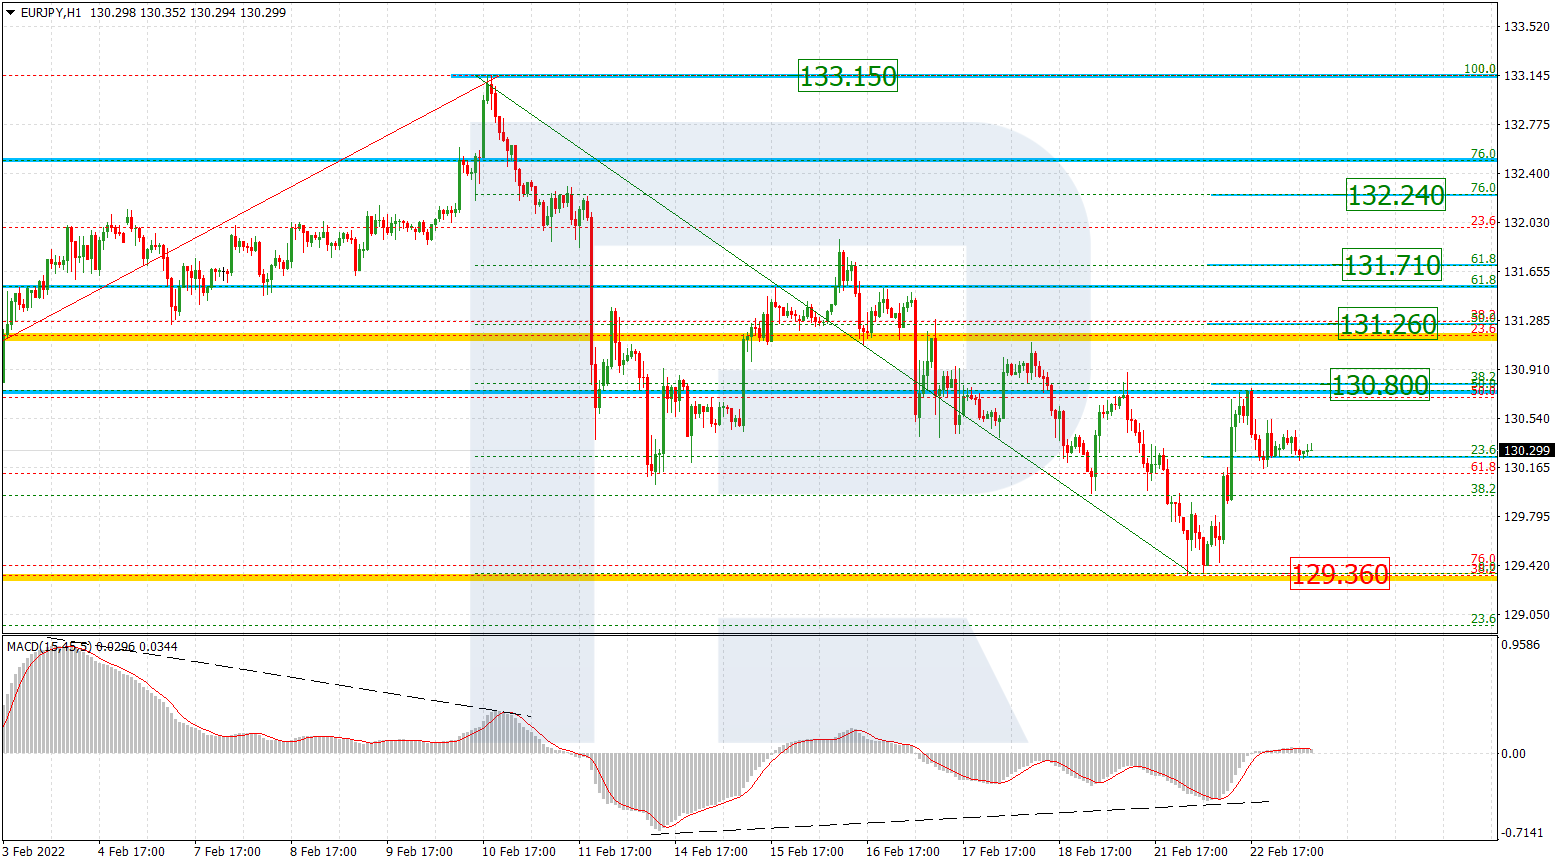
In the H1 chart, the price is correcting upwards and has already reached 38.2% fibo. The next correctional wave may be heading towards 50.0% and 61.8% fibo at 118.79 and 119.02 respectively. The support is the low at 117.75.