BTCUSD, “Bitcoin vs US Dollar”
As we can see in the H4 chart, after finishing the descending correction at 61.8% fibo, Bitcoin is trying to form a new rising wave. The first ascending structure has already reached 50.0% fibo and may later continue towards 61.8% and 76.0% fibo at 11463.00 and 11845.00 respectively, as well as the high at 12479.50. However, one shouldn’t exclude a possibility of a decline towards the local low at 9824.00. in this case, the price may break the low and then continue trading downwards to reach 76.0% fibo at 9696.00. The key target of such decline may be the fractal low at 8814.20.


In the H1 chart, the local convergence made the pair reverse and reach 61.8% fibo. Later, the price may reach 76.0% fibo and the high at 10928.00 and 11180.00 respectively to confirm further mid-term uptrend. However, if the asset breaks 10129.50, the price may start a new mid-term descending wave.


ETHUSD, “Ethereum vs. US Dollar”
As we can see in the H4 chart, the divergence made the pair complete the uptrend and start a new decline, which is testing 38.2% fibo. The next downside targets may be 50.0% and 61.8% fibo at 289.00 and 242.50 respectively. The resistance is the high at 488.68.


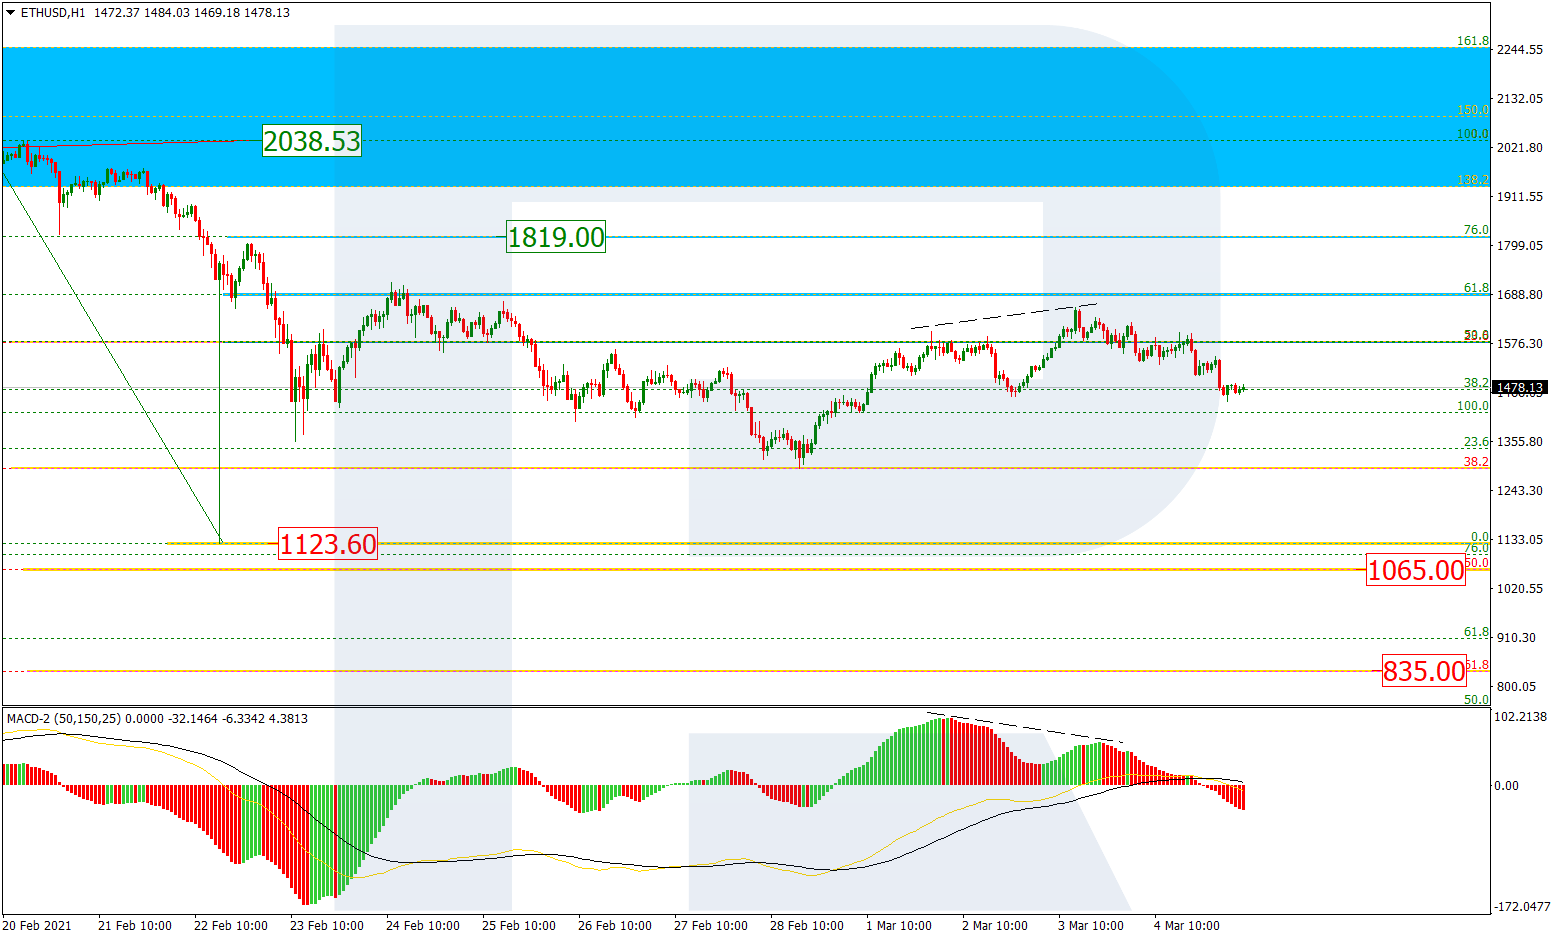
In the H1 chart, the pair has reached 50.0% fibo after the local convergence. After a short-term pullback, the price may reach 61.8% and 76.0% fibo at 363.05 and 374.70 respectively, as well as the high at 394.21. However, if the market breaks the low at 312.81, the instrument may reach the mid-term 50.0% fibo at 289.00.

