GBPUSD, “Great Britain Pound vs US Dollar”
In the H4 chart, the ascending tendency continues. GBPUSD has already broken 76.0% fibo and may soon attack the high at 1.3482. At the same time, one can see divergence on MACD to indicate a possible pullback in the nearest future with the target at the local support at 61.8% fibo (1.3174). However, if the asset yet breaks the high at 1.4382, the instrument may continue growing to reach the long-term 76.0% fibo at 1.3664.


The H1 chart shows a correctional Triangle pattern. Later, the pattern may be followed by further growth towards the high and a divergence. After that, the instrument may start a new pullback to reach 23.6%, 38.2%, and 50.0% fibo at 1.3334, 1.3241, and 1.3168 respectively.


EURJPY, “Euro vs. Japanese Yen”
In the H4 chart, the asset is forming a new rising impulse after finishing the correction. The first structure has already reached 61.8% fibo, while the second one may continue towards 76.0% fibo at 125.76 and then the high at 127.07. If later the price breaks the high, the instrument may continue trading upwards to reach the mid-term 61.8% fibo at 128.65. At the same time, the asset may rebound from the high and start a new descending wave towards the key support and 50.0% fibo at 121.62 and 120.74 respectively.


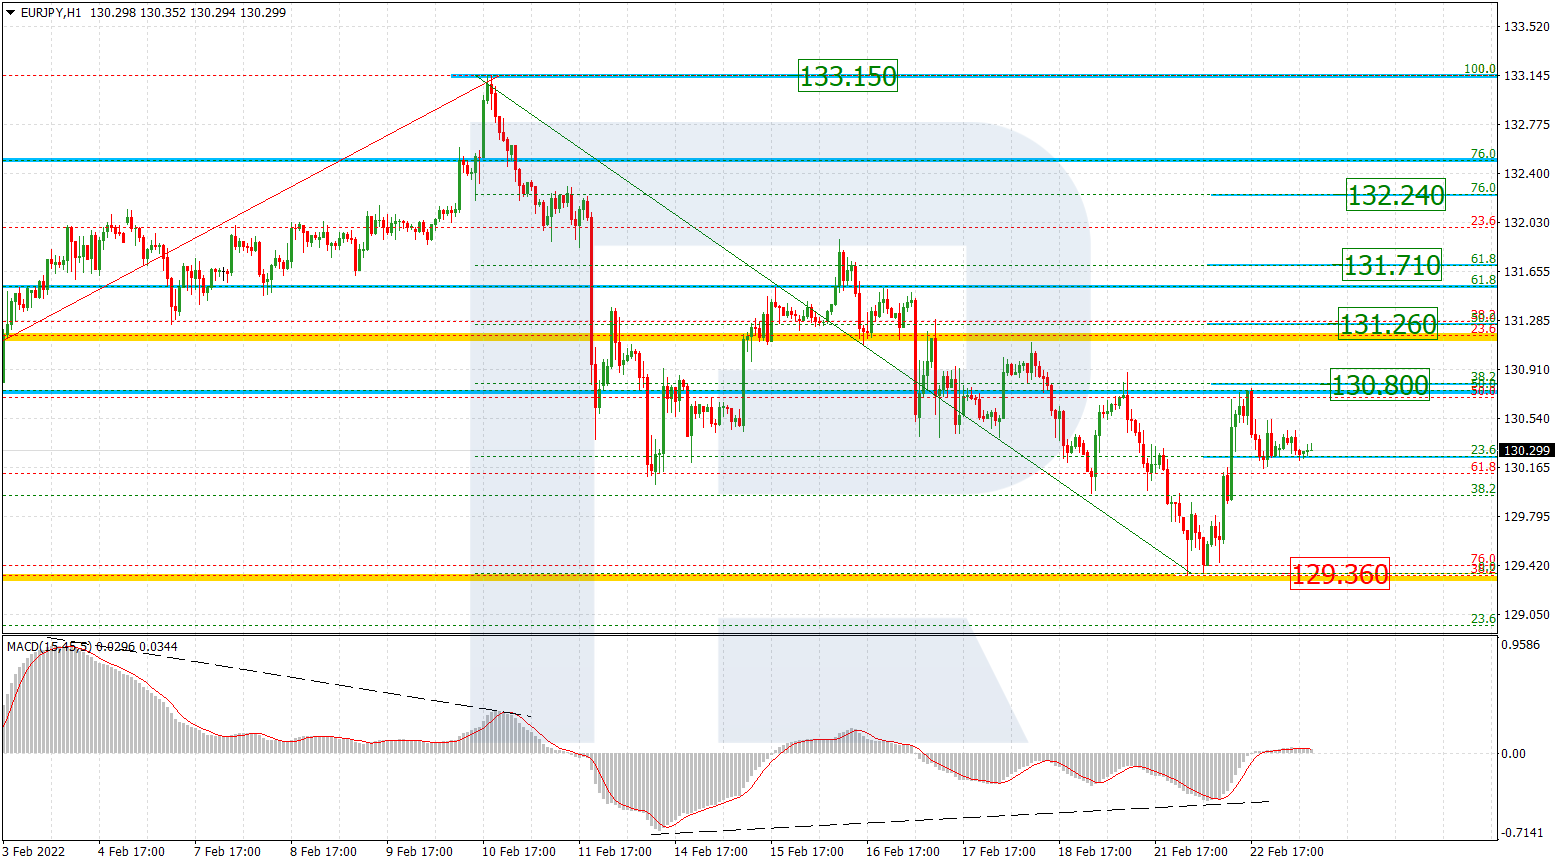
The H1 chart shows a new rising impulse, which has reached 61.8% fibo. The next upside targets may be 76.0% fibo and the local high at 124.59 and 125.14 respectively. The key support is the fractal low at 122.84.

