Brent
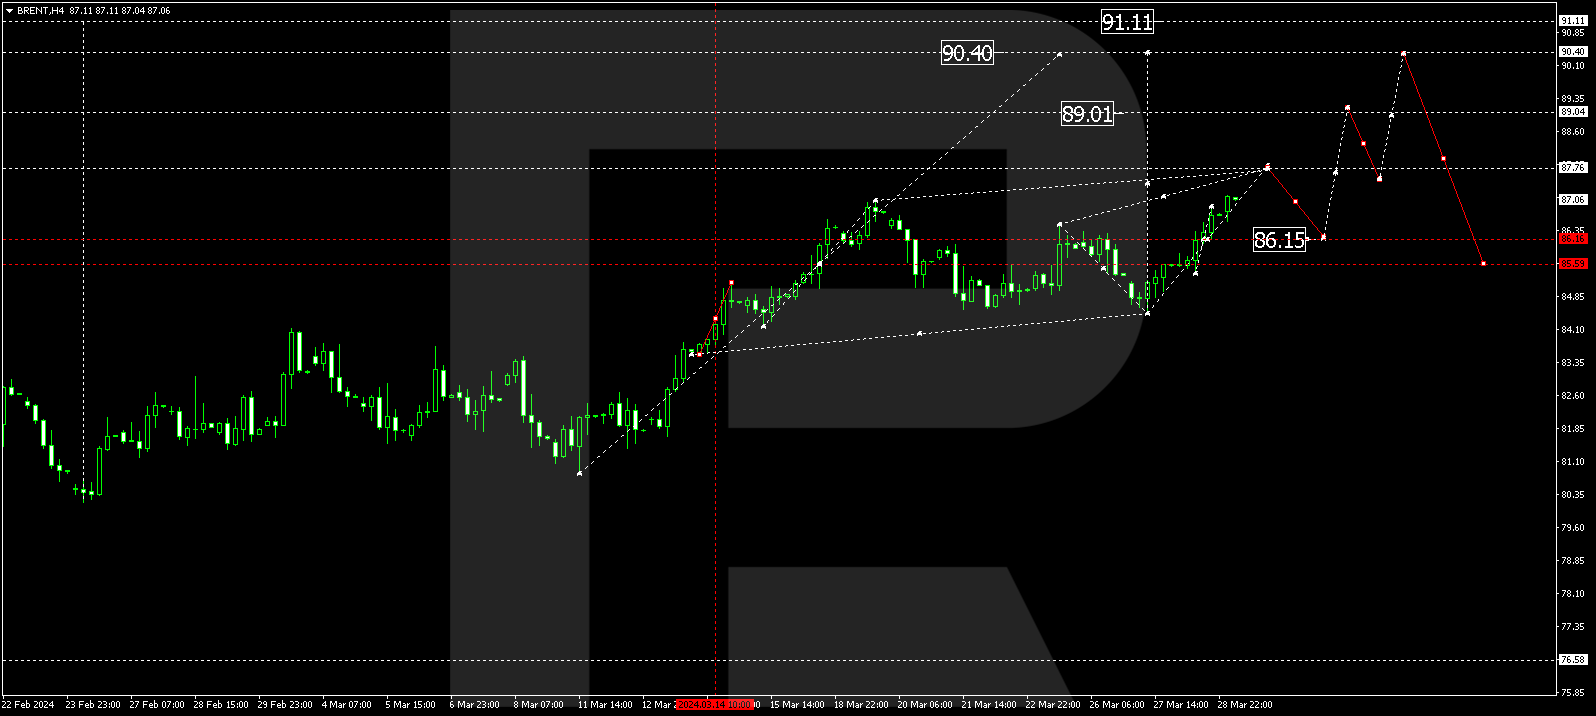
As we can see in the H4 chart, after finishing the correctional decline at 38.2% fibo, Brent is growing and this ascending movement may continue to break the high at 86.83. However, another scenario implies a new wave to the downside to reach 50.0% and 61.8% fibo at 75.83 and 73.31 respectively.


The H1 chart shows a more detailed structure of the current ascending correctional impulse, which, after reaching 50.0% fibo, has started a sideways channel in the form of a Flag pattern. Overall, this movement may be considered as an upside continuation pattern. The next upside targets may be 61.8% and 76.0% fibo at 83.37 and 84.58 respectively. The support is the low at 78.10.


Dow Jones
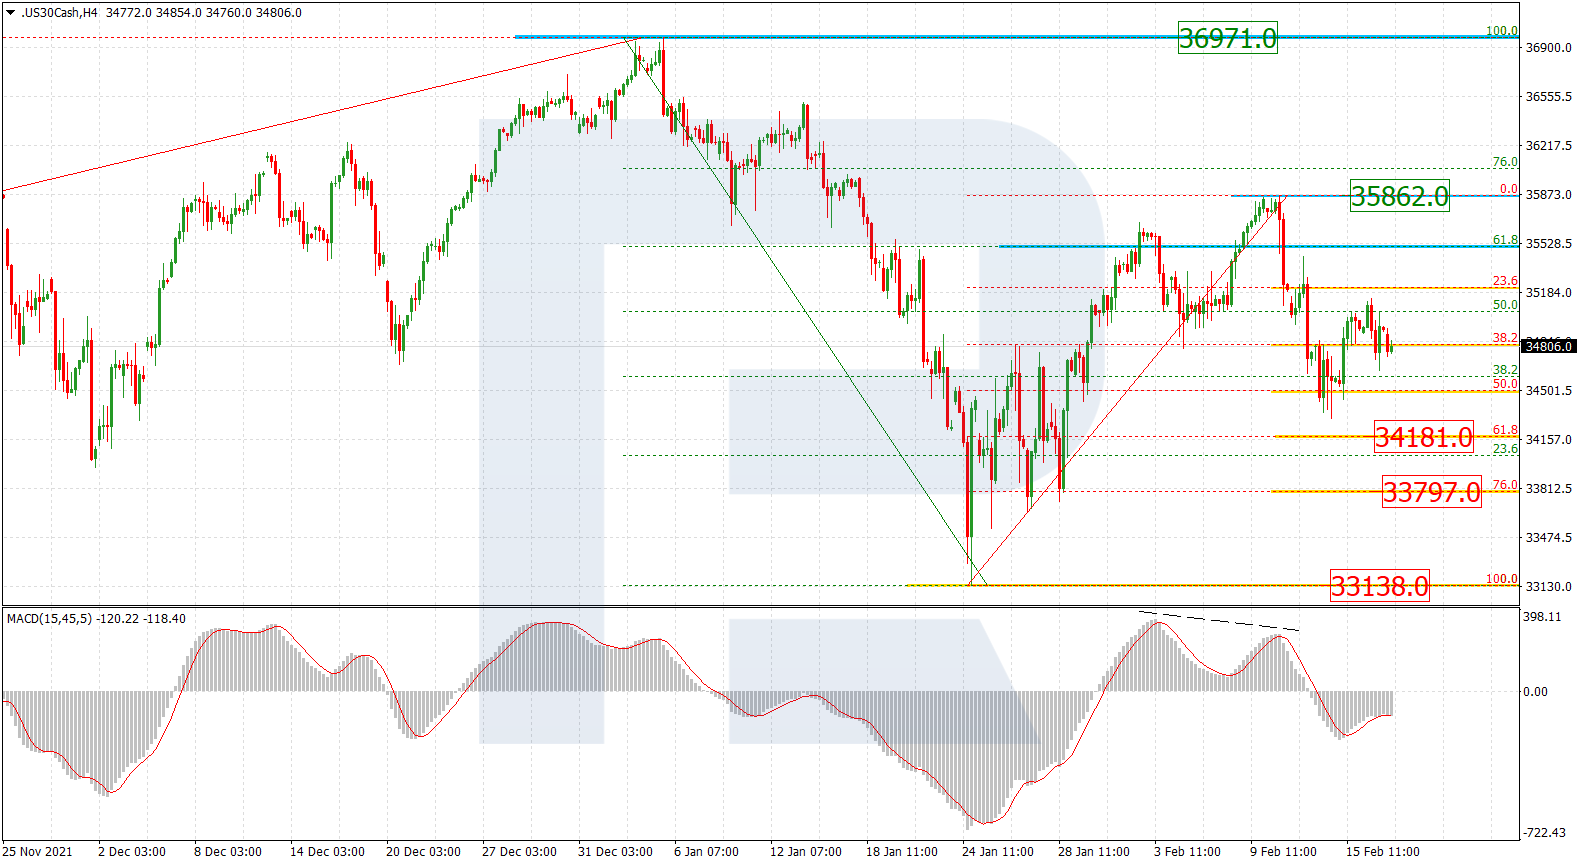
As we can see in the H4 chart, the asset has rebounded from the high, which was also the support area. If the price forms a steady rising impulse, it may reach the post-correctional extension area between 138.2% and 161.8% fibo at 36435.0 and 36938.0 respectively. The key downside target and the support is the fractal low at 33517.0.


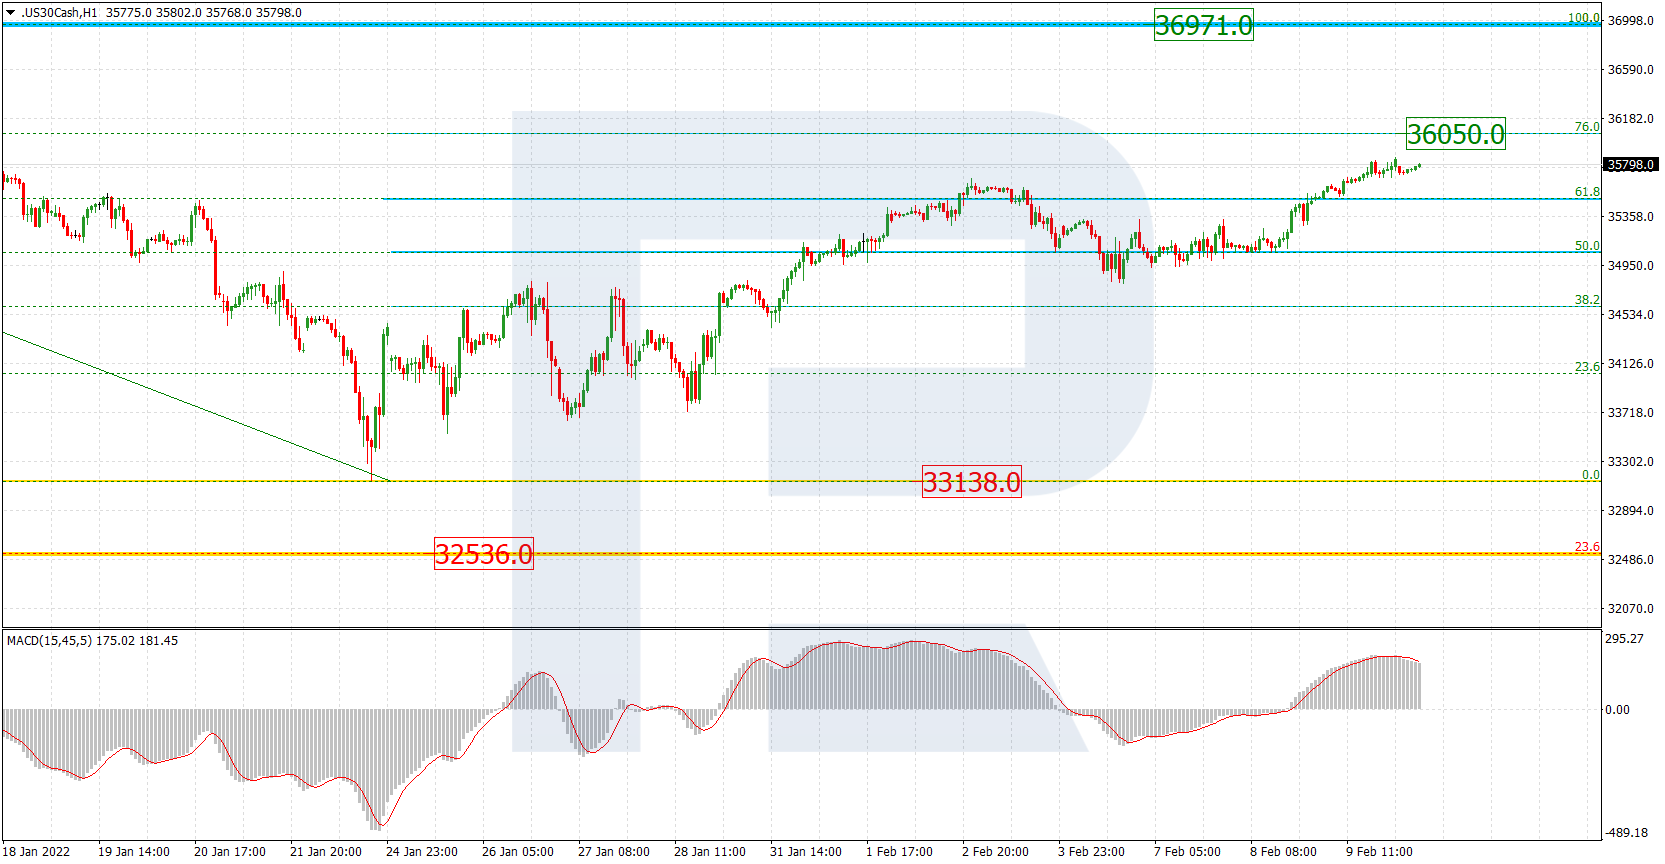
The H1 chart shows a new rising movement after convergence on MACD and an attempt to test 38.2% fibo at 35405.0. In this case, the asset may continue growing to reach the high at 36570.0. On the other hand, as long as the price is moving below the high, it may easily start another decline towards 50.0% fibo at 35046.0.

