BTCUSD, “Bitcoin vs US Dollar”
In the H4 chart, BTCUSD has slowed down its growth after breaking the post-correctional extension area between 138.2% and 161.8% fibo at 17660.00 and 20000.00 respectively. At the moment, the asset may start a mid-term pullback to reach 23.6%, 38.2%, 50.0%, and 61.8% fibo at 19493.00, 16517.27, 14122.15, and 11720.00 respectively. However, after a breakout of the high at 24292.80, the key long-term upside target will be 261.8% fibo at 29917.00.


The H1 chart shows a pullback after the previous ascending wave. After the first correctional impulse broke 23.6% fibo, the asset has returned to the high. At the moment, the pair is falling again and may later reach 38.2%, 50.0%, and 61.8% fibo at 21727.40, 20932.70, and 20150.70 respectively.


ETHUSD, “Ethereum vs. US Dollar”)
The H4 chart shows a new correctional downtrend after a breakout of the long-term 38.2% fibo and divergence on MACD. The first descending wave has almost reached 23.6% fibo at 536.35 and may later continue towards 38.2% and 50.0% fibo at 449.17 and 378.68 respectively. However, if the asset breaks the high at 676.65, the price may continue growing to reach the long-term 50.0% fibo at 751.20.


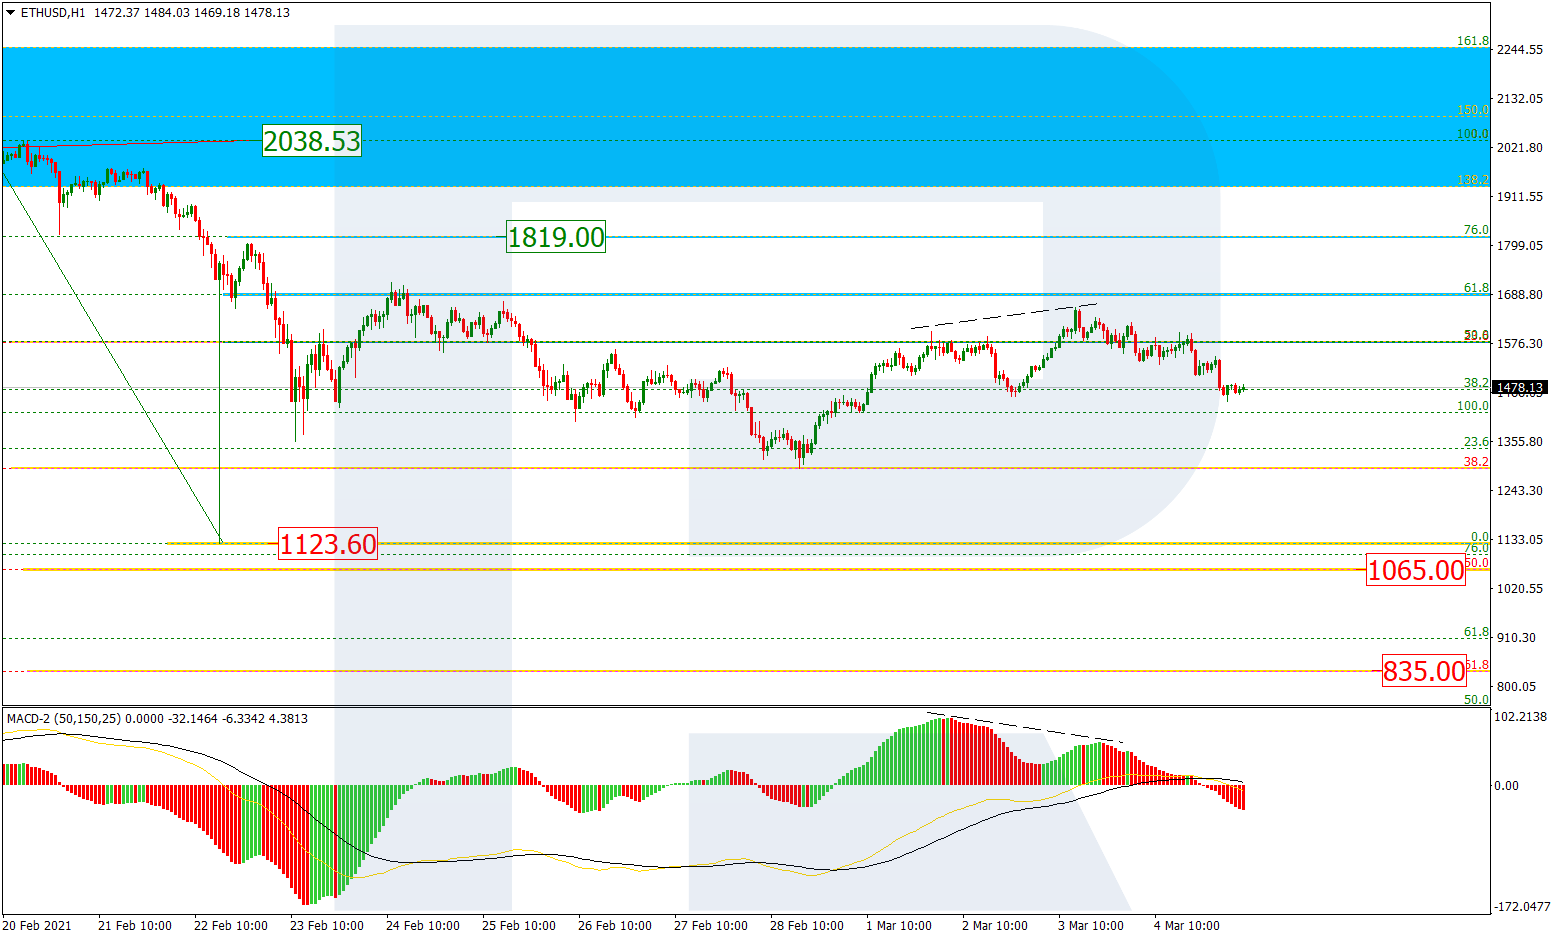
As we can see in the H1 chart, a correctional decline has reached 61.8% fibo. After a local convergence, the asset may grow to attack the high at 676.65 and try to enter the post-correctional extension area between 138.2% and 161.8% fibo at 677.60 and 711.39 respectively. However, one shouldn’t exclude further mid-term downtrend. To confirm this idea, the pair must fall to break 76.0% fibo at 528.09 and then reach the low at 481.10.

