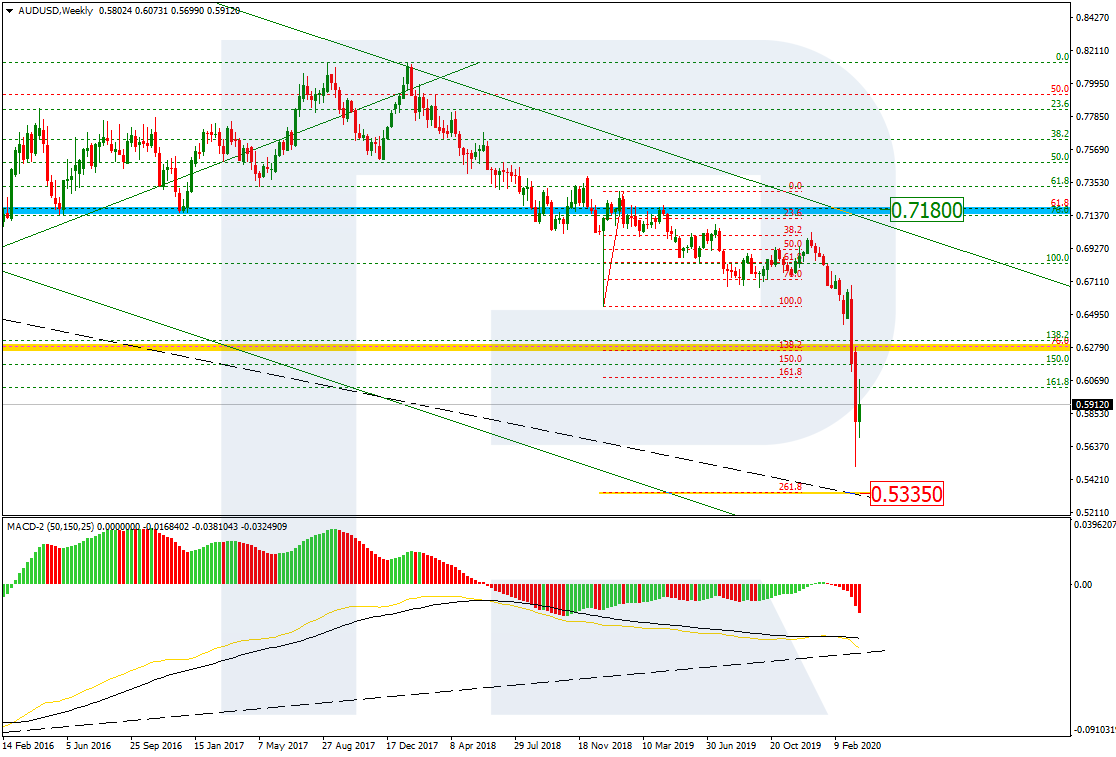
AUDUSD, “Australian Dollar vs US Dollar”
As we can see in the weekly chart, after completing a strong descending impulse, AUDUSD has started a new rising correction. However, judging by the technical characteristics of the tendency, the decline is not over yet, hence the pullback may be followed by a new descending impulse with the target 261.8% fibo at 0.5335. The resistance is still at 61.8% fibo (0.7180).

The H4 chart shows more detailed structure of the current correction. After breaking 38.2% fibo and attempting to reach 50.0% fibo at 0.6098, AUDUSD has rebounded from the latter level; right now, it is moving downwards. One can’t exclude the possibility of a new rising impulse towards 50.0% and 61.8% fibo at 0.6098 and 0.6237 respectively, but a bearish scenario seems more probable. The support is the low at 0.5506.

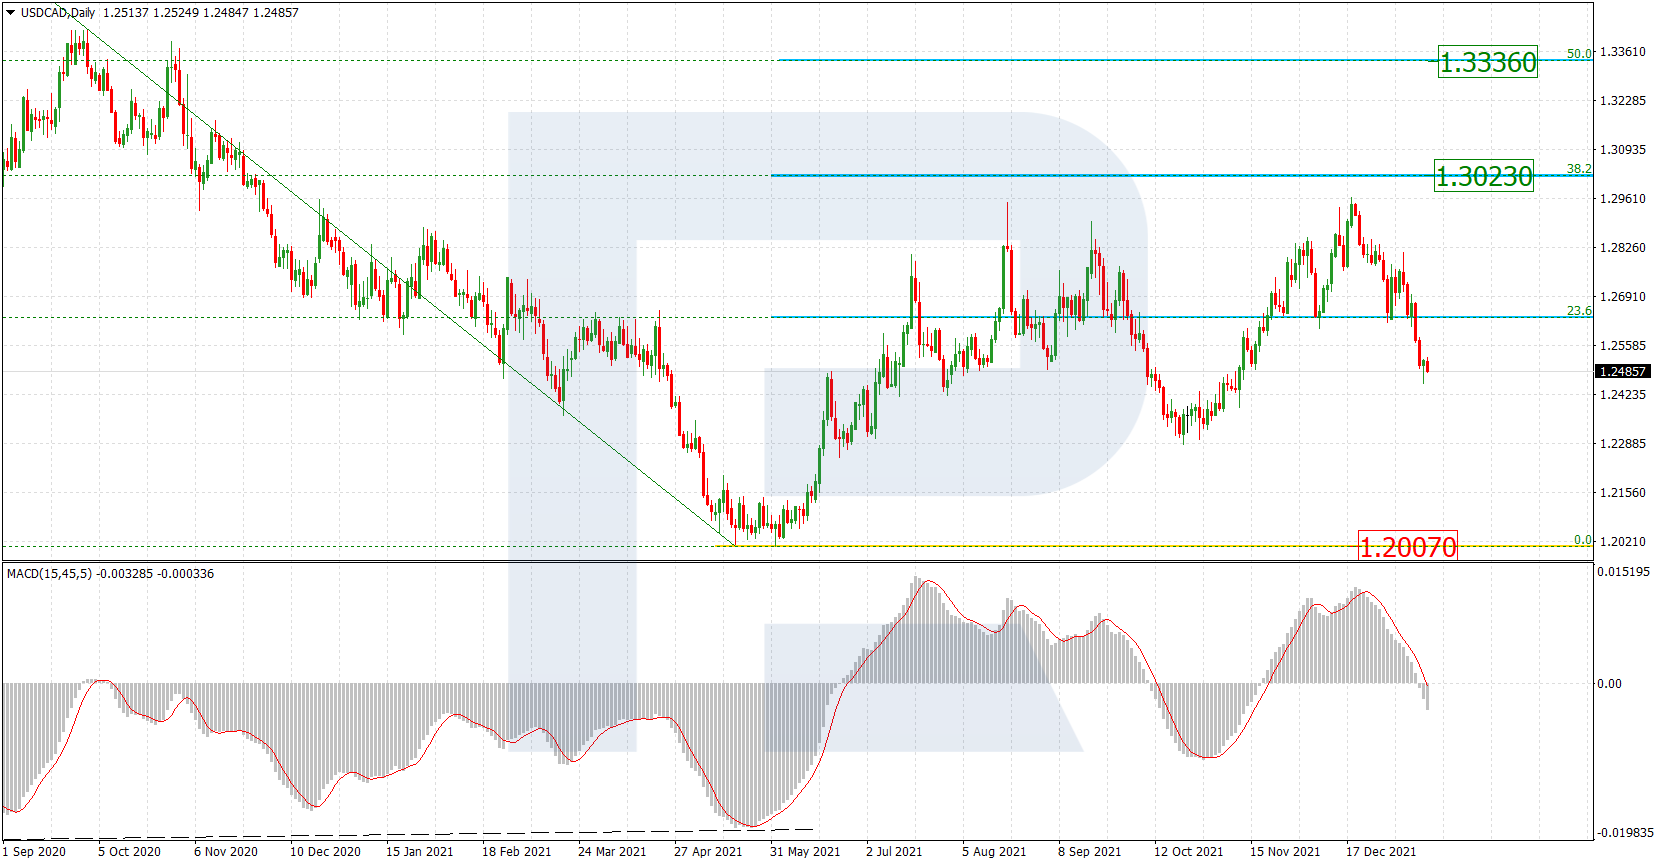
USDCAD, “US Dollar vs Canadian Dollar”
The daily chart shows a new correction after the pair completed a quick rising impulse and reached the long-term high at 1.4690. If the price breaks this level, it may continue growing to reach the post-correctional extension area between 138.2% and 161.8% fibo at 1.5693 and 1.6325 respectively. However, by now, the instrument has corrected to the downside by 23.6%.
As we can see in the H4 chart, the correctional channel is getting narrow. There are chances that the market may break the downside border of a Triangle pattern and reach 38.2% and 50.0% fibo at 1.4010 and 1.3811 respectively. The resistance is at 1.4668.
