BTCUSD, “Bitcoin vs US Dollar”
In the daily chart, the situation has remained unchanged for quite a long time. After Bitcoin reached the mid-term 61.8% fibo, there was a divergence but the price failed to start a new downtrend. All attempts to grow are facing strong bearish pressure. The asset is still trading between the high (10368.40) and the first correctional target, which is 23.6% fibo at 8848.00. If the instrument breaks this level, it may continue falling towards the next targets – 38.2% and 50.0% fibo at 7907.00 and 7150.00 respectively.
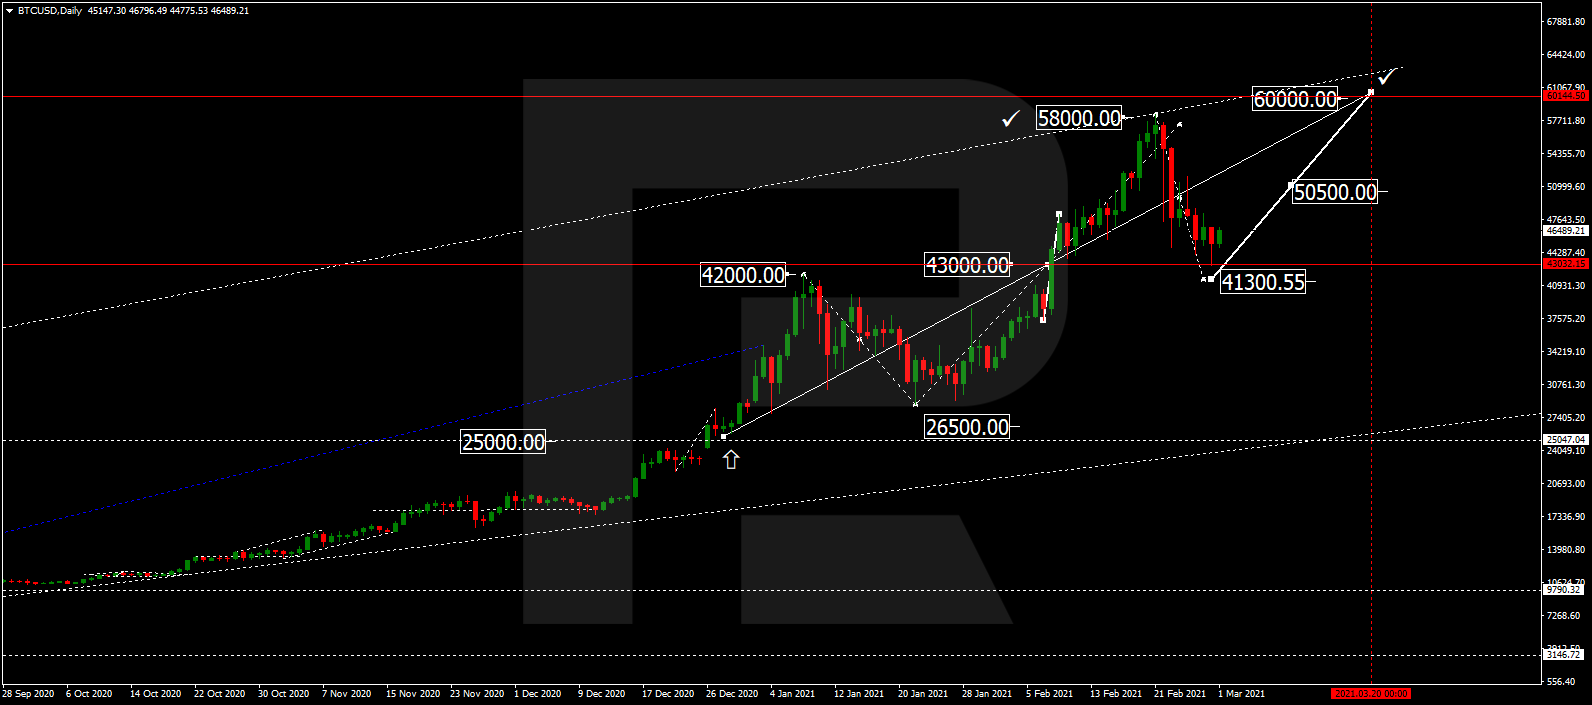

As we can see in the H4 chart, after completing the local rising correction, the pair has finished the descending impulse towards 23.6% fibo at 8848.00.

ETHUSD, “Ethereum vs. US Dollar”
As we can see in the daily chart, Ethereum moving close to 76.0% fibo. Earlier, the asset tried to resume moving downwards but failed to break the support at 61.8% fibo at 212.70. The bearish scenario remains more probably but once shouldn’t exclude the possibility of further growth towards the fractal high at 288.98.
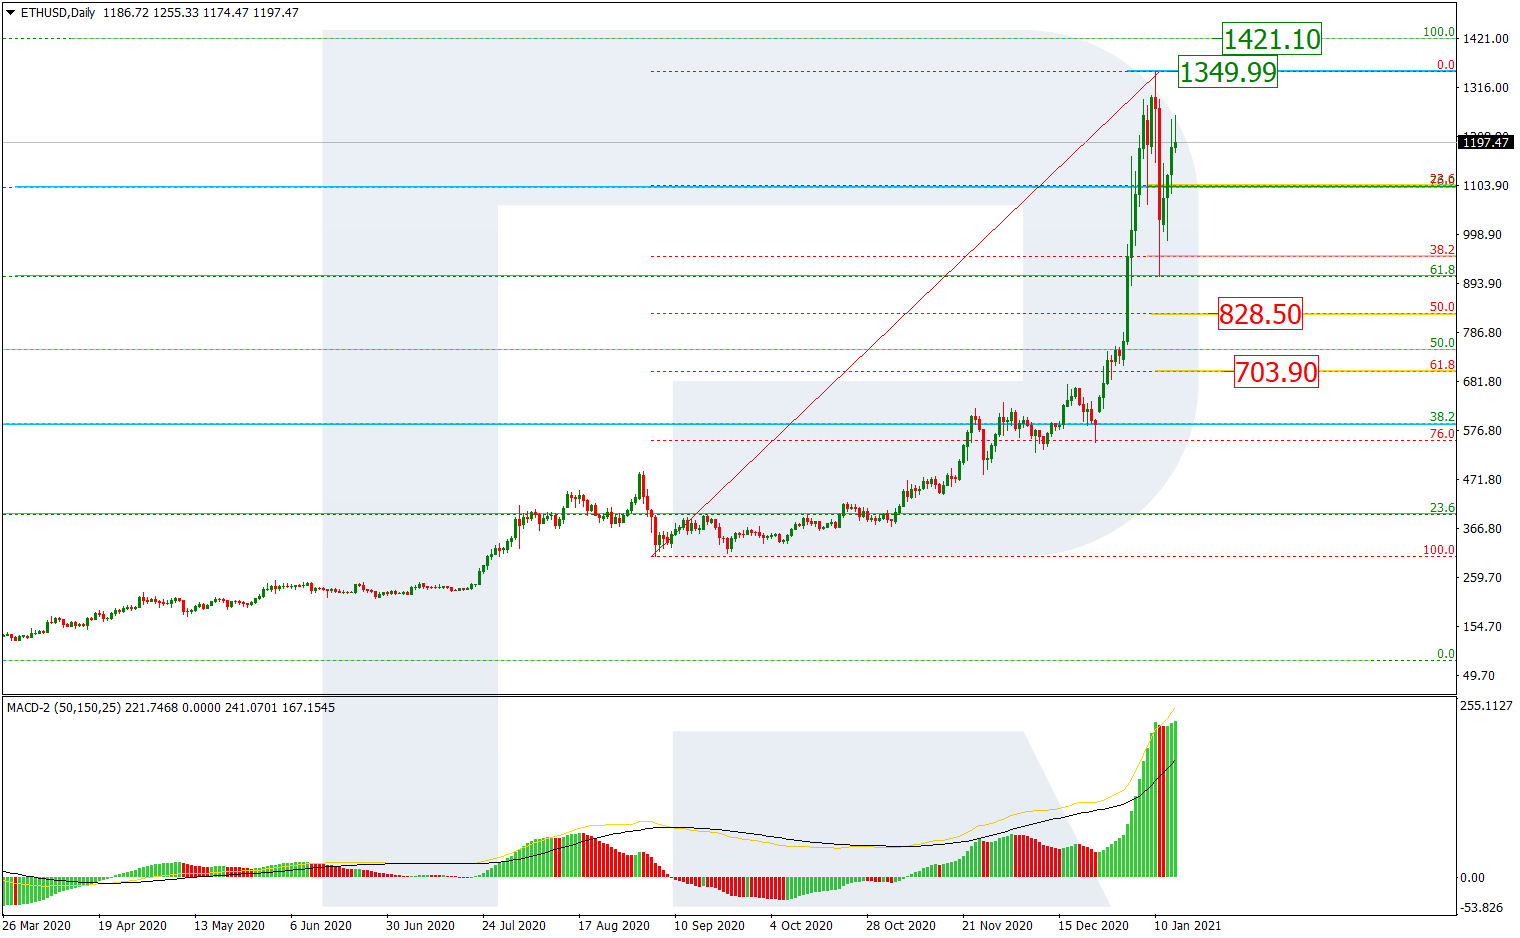
The H4 chart shows a more detailed structure of the current descending wave after an attempt to test the high at 253.47. The downside target may be 23.6%, 38.2%, and 50.0% fibo at 214.90, 191.00, and 171.60 respectively.
