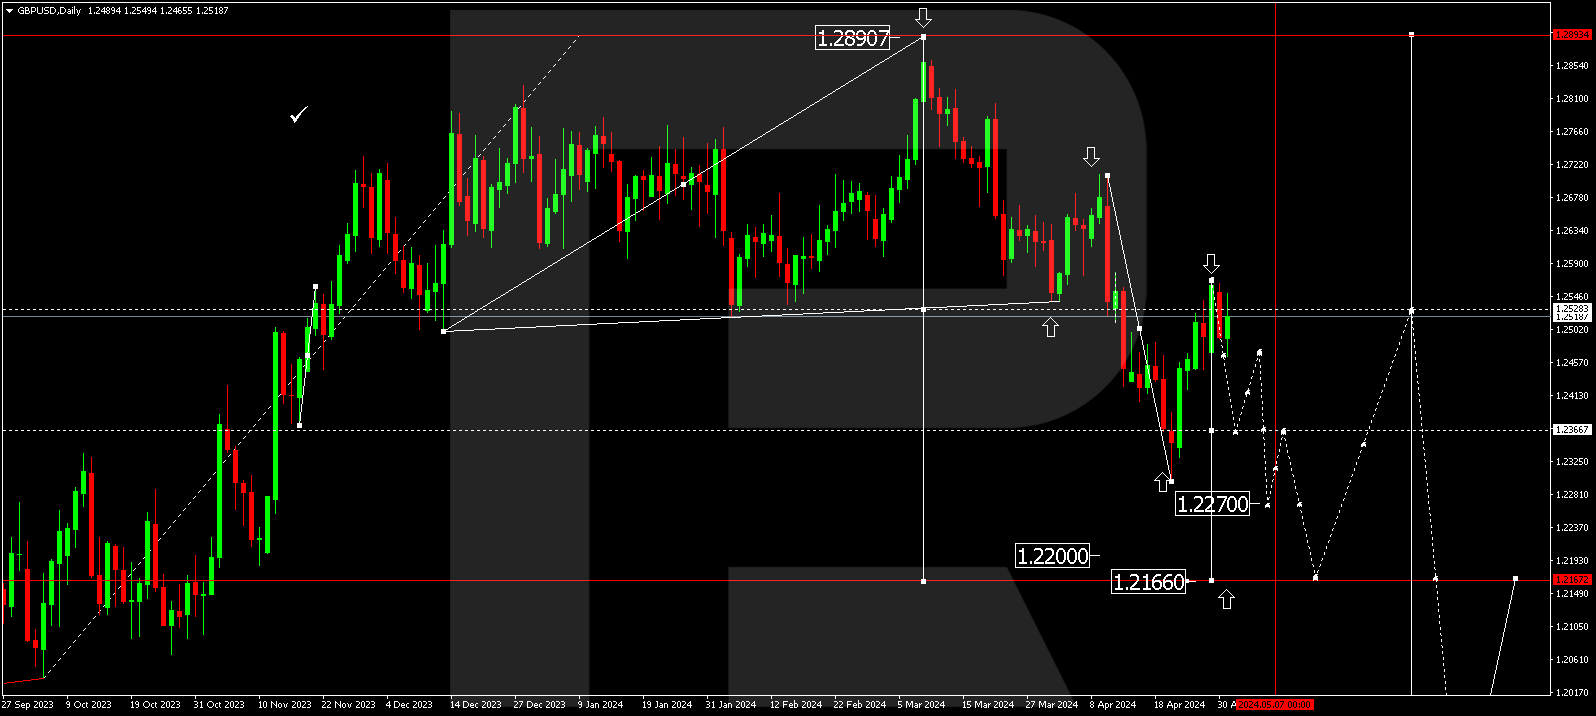
GBPUSD, “Great Britain Pound vs US Dollar”
As we can see in the daily chart, GBPUSD has reached the long-term 61.8% fibo while moving within the uptrend. At the same time, the MACD indicator is forming a local divergence, which may hint at a possible pullback. The closest downside target may be the local support at 50.0% fibo (1.2895). After completing the correction, the next rising impulse may be heading towards the long-term 76.0% fibo at 1.3660.

In the H4 chart, the pair has reached the post-correctional extension area between 138.2% and 161.8% fibo. At the same time, the MACD indicator is forming a divergence, which may hint at a new correction. The closest target of this pullback may be 23.6% fibo at 1.3028, while the next ones are 38.2%, 50.0%, and 61.8% fibo at 1.2879, 1.2759, and 1.2640 respectively. However, if the price breaks the high at 1.3267, the instrument may continue the uptrend.

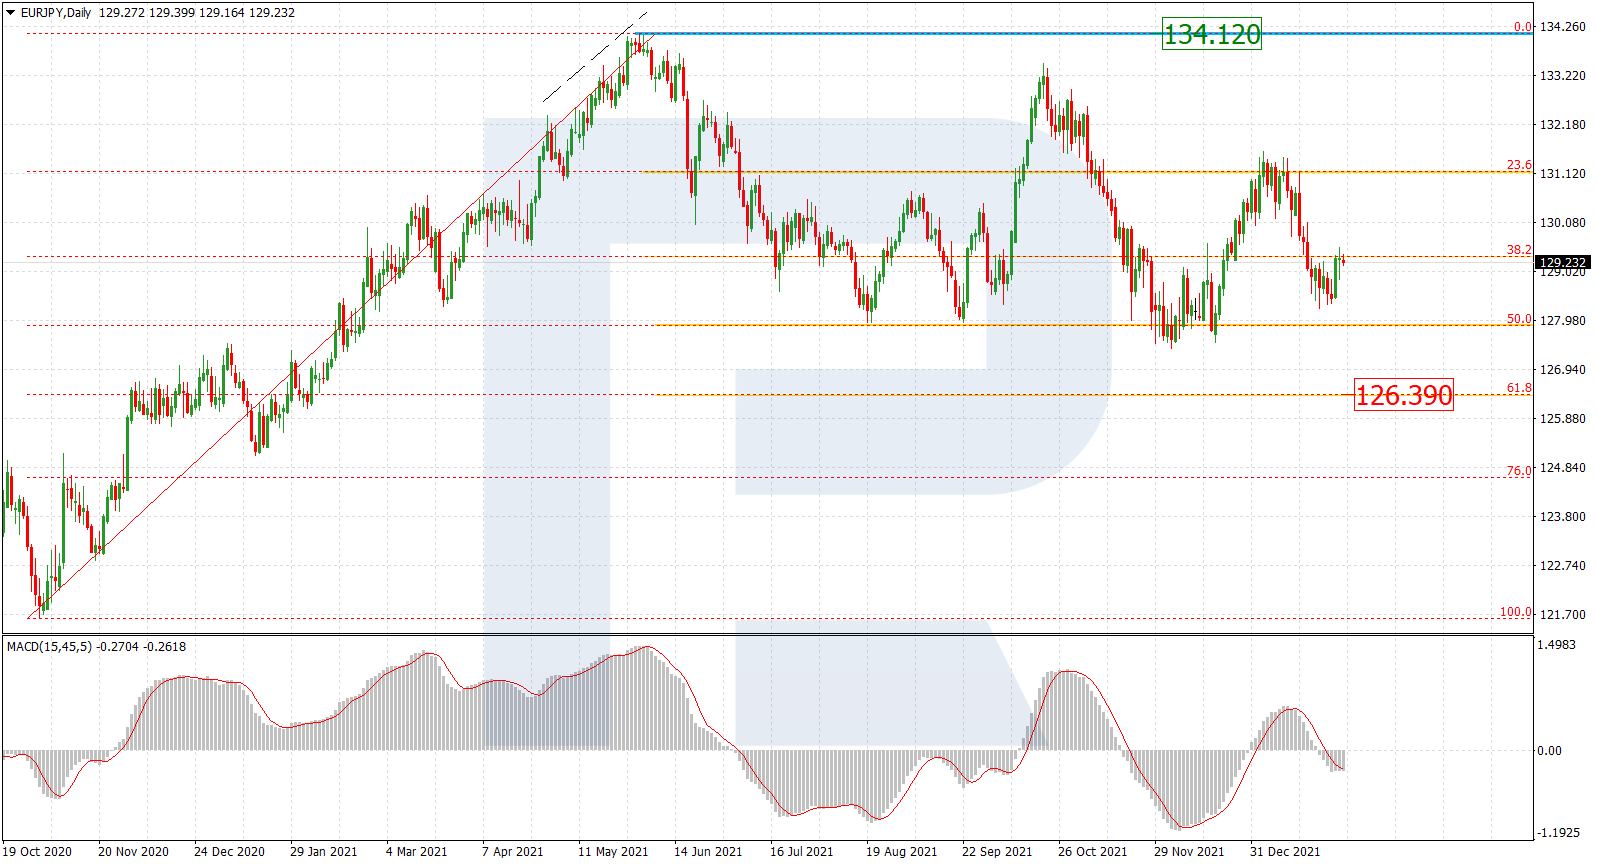
EURJPY, “Euro vs. Japanese Yen”
As we can see in the daily chart, EURJPY has reached the long-term 50.0% fibo and the post-correctional extension area between 138.2% and 161.8% fibo at 126.38 and 127.57 respectively. such a technical picture may indicate a possible correction in the form of a sideways channel. The next upside target may be the long-term 61.8% fibo at 128.65.
In the H4 chart, after the first descending correctional wave and the divergence, the instrument is forming a local pullback. The first wave has already reached 23.6% fibo and may later continue towards 38.2%, 50.0%, and 61.8% fibo at 123.92, 123.04, and 122.16 respectively. The resistance is the high at 126.76.
