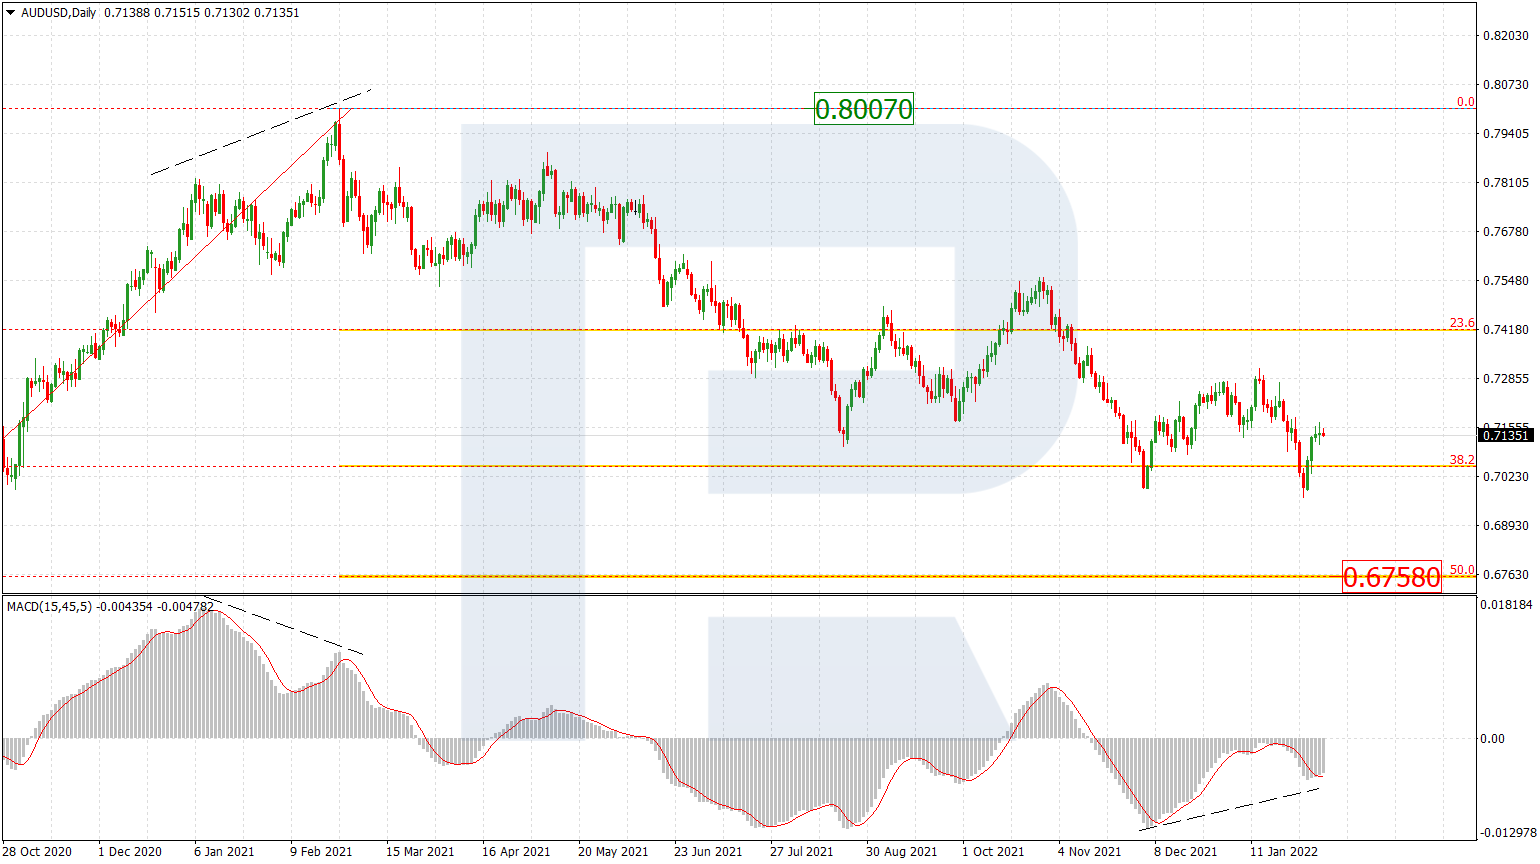
AUDUSD, “Australian Dollar vs US Dollar”
As we can see in the daily chart, after breaking the previous significant low, the pair is still trading downwards. The downside targets are inside the post-correctional extension area between 138.2% and 161.8% fibo at 0.6532 and 0.6447 respectively. The resistance is the previous low at 0.6671.


In the H4 chart, AUDUSD has reached the post-correctional extension area between 138.2% and 161.8% fibo at 0.6532 and 0.6447 respectively. At the same time, there is a convergence on MACD, which may indicate a new pullback towards the resistance.


USDCAD, “US Dollar vs Canadian Dollar”
As we can see in the H4 chart, after correcting towards 38.2% fibo, USDCAD has formed a new rising impulse to update the highs. The mid-term scenario for the instrument is bullish. The next upside targets are 61.8% and 76.0% fibo at 1.3391 and 1.3492 respectively.


In the H1 chart, after breaking the previous high, the pair is trying to fix above it. Later, the market may continue trading towards 61.8% fibo at 1.3391.

