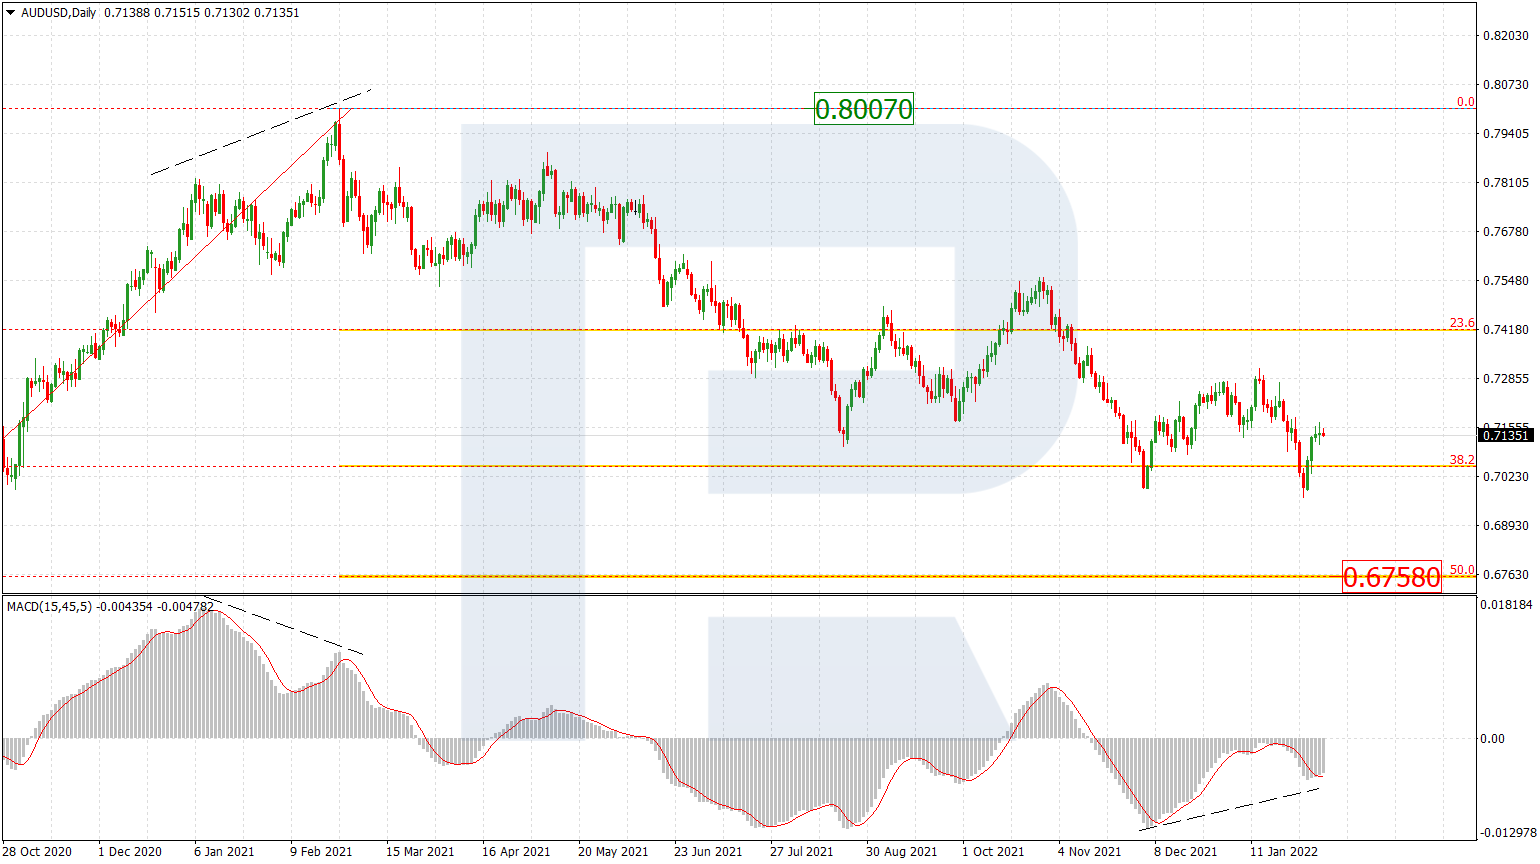
AUDUSD, “Australian Dollar vs US Dollar”
In the daily chart, after breaking the long-term 61.8% fibo, AUDUSD has been able to fix above this level; right now, it continues growing very slowly. In addition to that, the MACD indicator is forming a divergence, which may hint at a possible correction to the downside soon. The next downside correctional target may be the support not far from 50.0% fibo at 0.6818.

As we can see in the H4, the asset is still testing the upside border of the post-correctional extension area between 138.2% and 161.8% fibo at 0.7174 and 0.7241 respectively. Considering the divergence on MACD, such a long-running test of the above-mentioned area may hint at a new decline soon. The short-term downside target may be the previously broken fractal high at 0.7064.

USDCAD, “US Dollar vs Canadian Dollar”
As we can see in the H4 chart, after breaking the low at 1.3315 and fixing below it, USDCAD continues falling slowly; right now, it is moving inside the post-correctional extension area between 138.2% and 161.8% fibo at 1.3164 and 1.3068 respectively. The MACD indicator is forming a convergence to hint at a possible short-term pullback.

The H1 chart shows a more detailed structure of the correctional wave to the upside with the first target at 23.6% fibo (1.3195). after reaching and breaking this level, the instrument may continue growing towards 38.2% and 50.0% fibo at 1.3234 and 1.3265 respectively. The support is the low at 1.3132.
