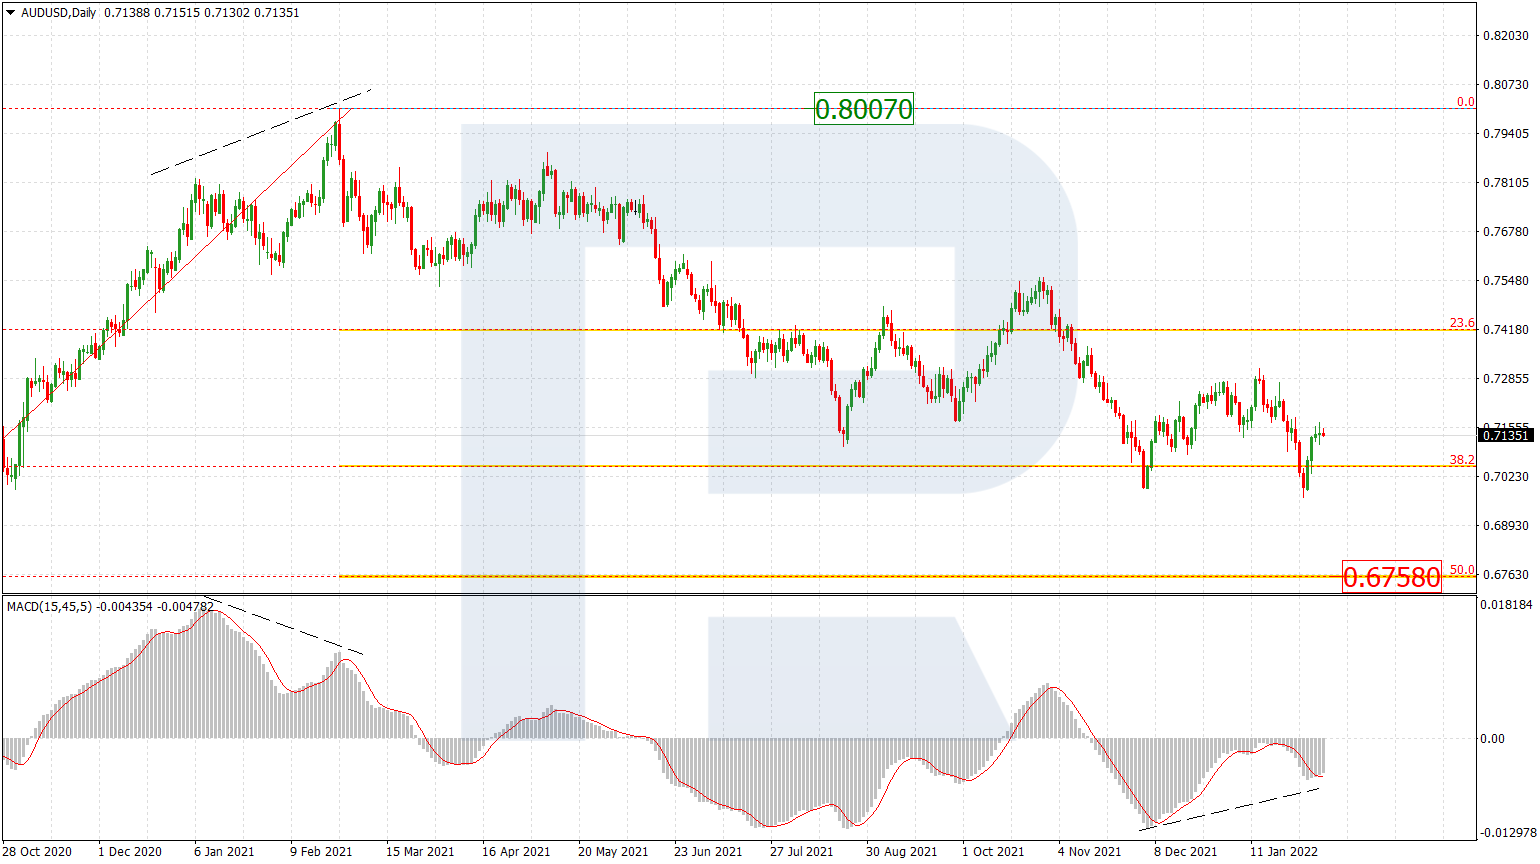
AUDUSD, “Australian Dollar vs US Dollar”
As we can see in the daily chart, AUDUSD has broken 38.2% fibo. In the long-term, the pair is expected to continue growing towards 50.0% and 61.8% fibo at 0.6820 and 0.7129 respectively. This scenario is confirmed by the MACD lines. The key support is the low at 0.5506.

In the H4 chart, AUDUSD has reached the fractal high at 0.6684. At the moment, we can see a divergence on MACD, which may indicate a possible tendency slowdown or even a pullback with the targets at 23.6%, 38.2%, 50.0%, and 61.8% fibo at 0.6403, 0.6234, 0.6095, and 0.5955 respectively.

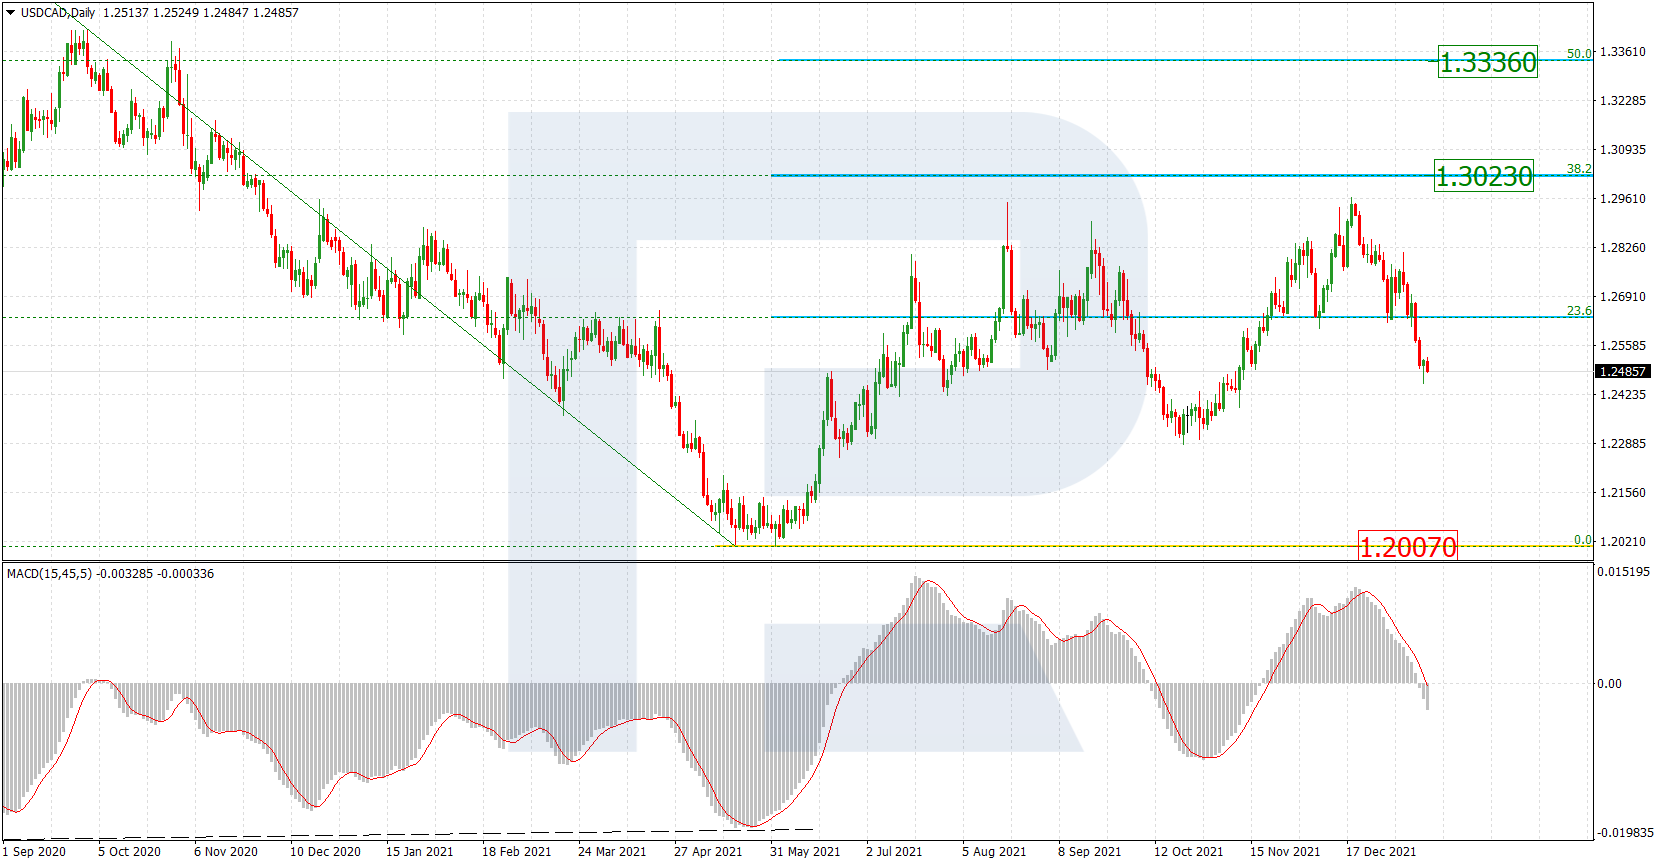
USDCAD, “US Dollar vs Canadian Dollar”
As we can see in the daily chart, after completing the correction and breaking 50.0% fibo, USDCAD may continue moving to reach 61.8% fibo at 1.3606. After finishing this descending correction, the instrument may start a new growth towards the high at 1.4668.
In the H14chart, after finishing the correction and breaking the low, the pair is forming another descending impulse. The targets are 61.8% fibo at 1.3606 and the post-correctional extension area between 138.2% and 161.8% fibo at 1.3700 and 1.3602 respectively.
