GBPUSD, “Great Britain Pound vs US Dollar”
As we can see in the H4 chart, the ascending correction continues. After breaking 38.2% fibo, GBPUSD is heading towards 50.0% fibo. However, it’s too early to expect the asset to reach the high at 1.4250. most likely, this correction will soon be replaced by a new descending wave with the short-term target at the low at 1.3572, a breakout of which may lead to a further downtrend towards the mid-term 50.0% fibo at 1.3463.


The H1 chart shows a more detailed structure of the current correctional uptrend, which is approaching 50.0% at 1.3911 and break it to reach 61.8% fibo at 1.3990. At the same time, there is divergence on MACD, which may indicate that the price is about to complete its short-term correction and resume falling towards the low.


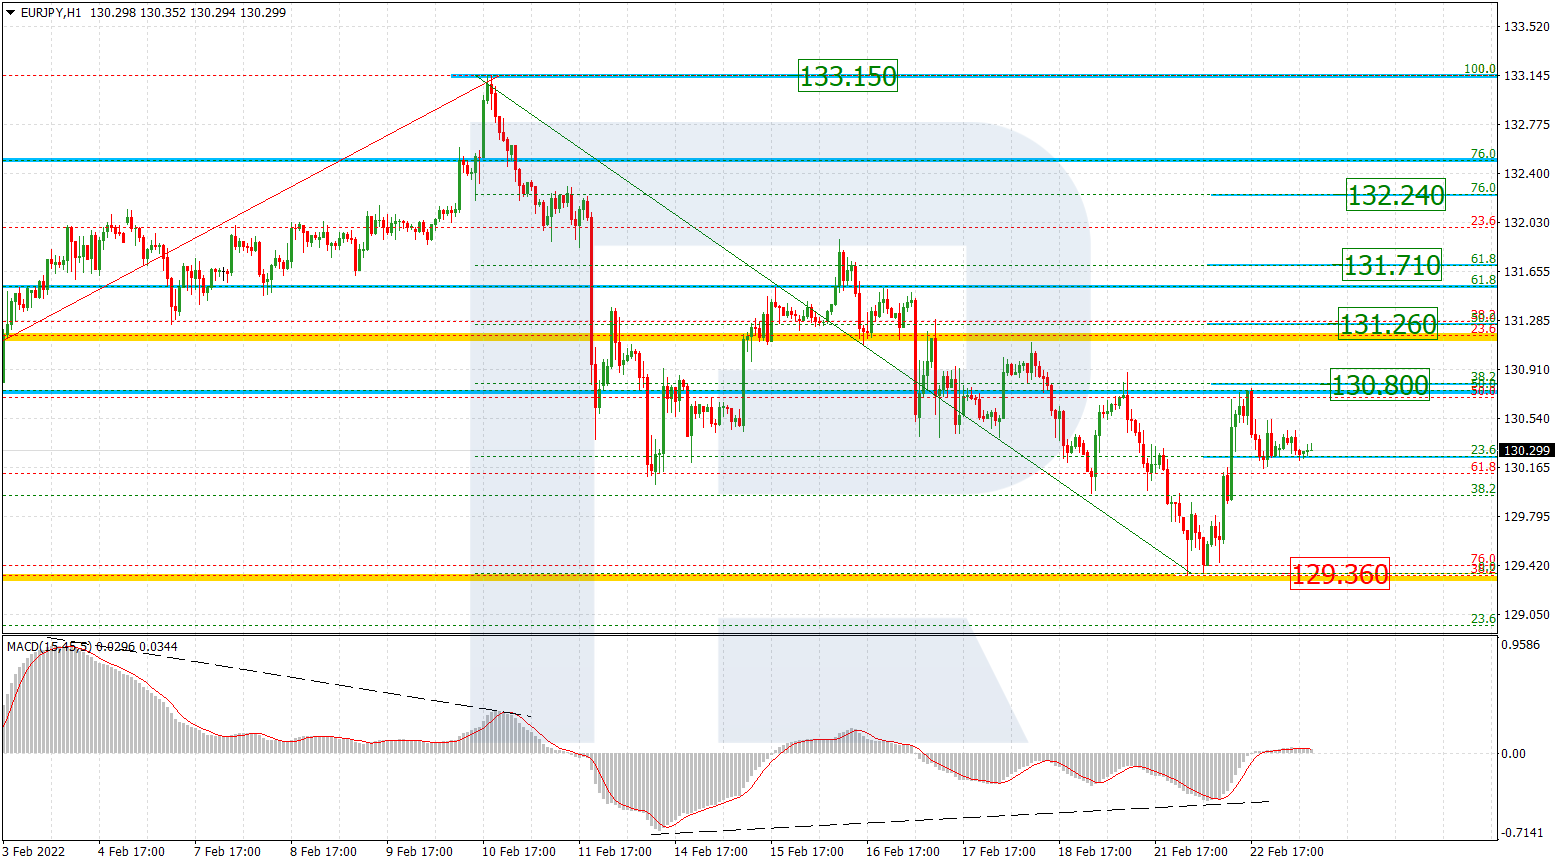
EURJPY, “Euro vs. Japanese Yen”
In the H4 chart, EURJPY has stopped its correctional uptrend and is currently trying to form a new descending structure to reach 50.0% and 61.8% fibo at 127.87 and 126.87 respectively. However, one shouldn’t expect the asset to extend the correction until it breaks the low. The key resistance is the high at 134.12.


As we can see in the H1 chart, divergence on MACD made the asset finish the correctional uptrend at 38.2% fibo. In this case, the pair may start a new descending wave to reach the low at 128.60. If later the instrument rebounds from the low, it may resume trading upwards to reach 50.0% and 61.8% fibo at 130.65 and 131.13 respectively.

