GBPUSD, “Great Britain Pound vs US Dollar”
As we can see in the H4 chart, the correctional uptrend is heading towards 61.8% fibo at 1.2350. After completing the correction, GBPUSD may form a new descending structure to reach the support at 1.2015. The mid-term downside targets are inside the post-correctional extension area between 138.2% and 161.8% fibo at 1.2019 and 1.1788 respectively.


More detailed structure of the current correction is shown on the H1 chart. Right now, the pair is re-testing 50.0% fibo. Later, the market may continue moving towards 61.8% fibo at 1.2350. At the same time, there is a divergence within the uptrend on MACD, which may indicate a forthcoming reverse.

EURJPY, “Euro vs. Japanese Yen”
As we can see in the H4 chart, after EURJPY broke the significant low, there was a convergence on MACD, which was later followed by the first correctional impulse towards 23.6% fibo. The next correctional targets may be 38.2%, 50.0%, and 61.8% fibo at 119.15, 119.95, and 120.76 respectively. The support is at 116.56.

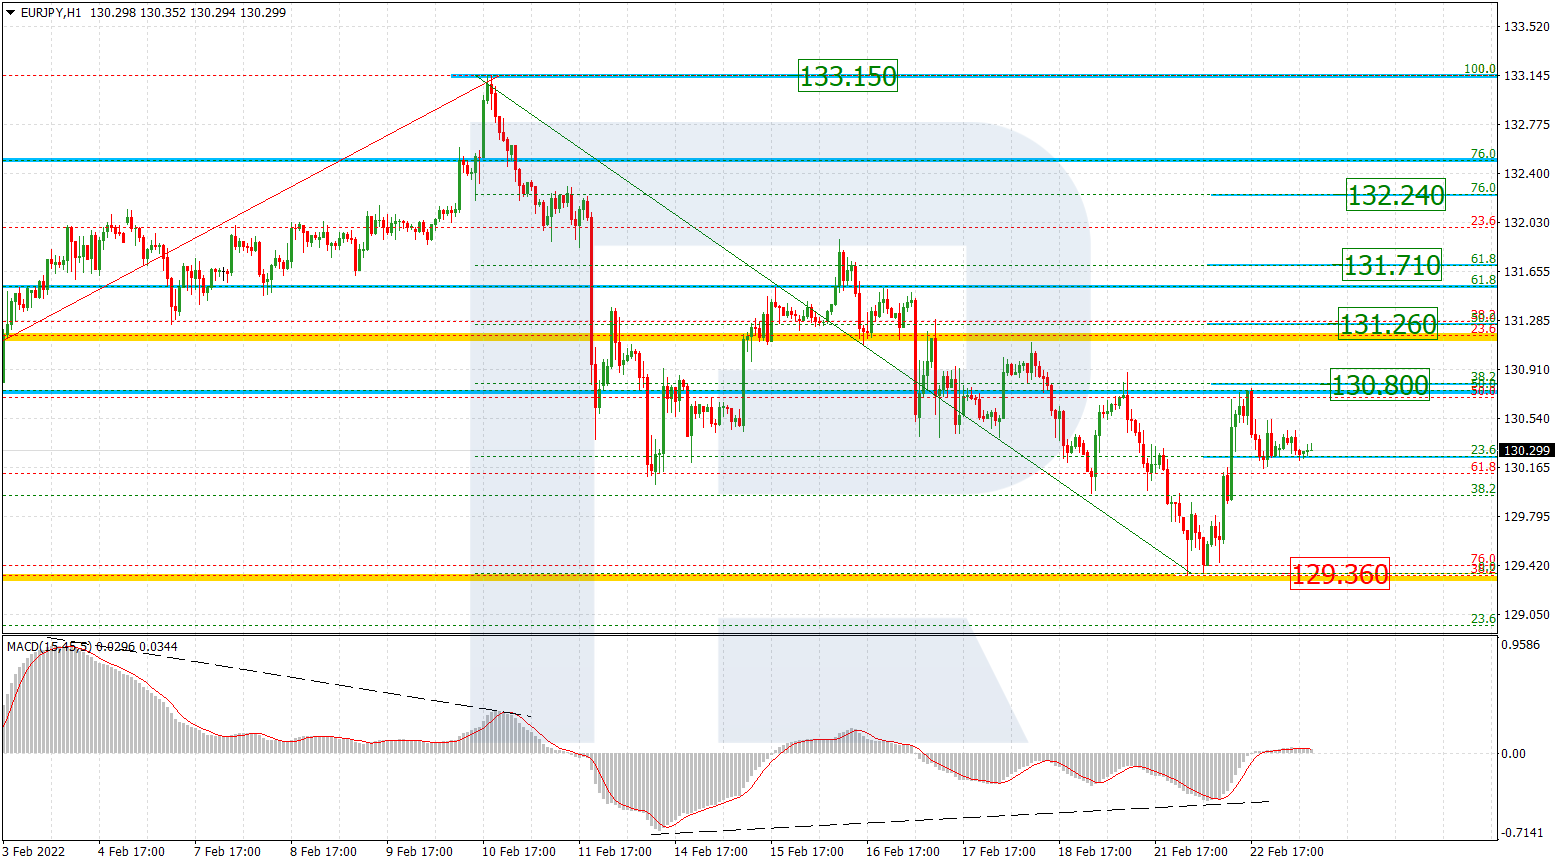
In the H1 chart, after completing the rising impulse, the pair is correcting to the downside and has already reached 61.8% fibo. Later, the market may continue the correction towards 76.0% fibo at 116.95.