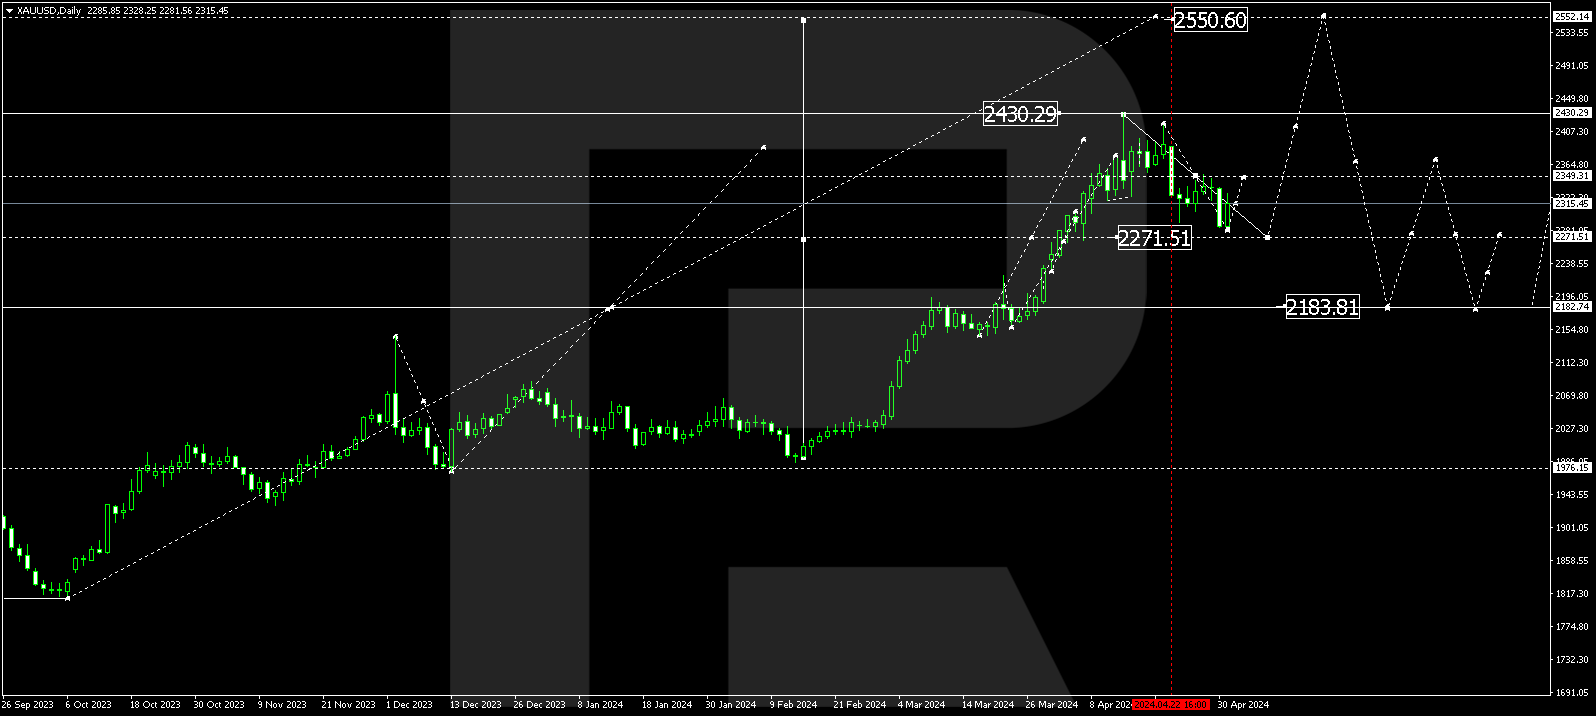
XAUUSD, “Gold vs US Dollar”
As we can see in the daily chart, after falling and reaching 38.2% fibo, the pair has returned to its highs. There is a strong possibility that the price may break the high at 1703.13 and reach 76.0% fibo at 1708.85 but the main scenario implies a new wave to the downside with the targets at 50.0% (1431.95), 61.8% (1367.80), and 76.0% (1290.40).

In the H1 chart, there is a local divergence, which may indicate a new descending wave soon. In this case, the downside targets may be 23.6%, 38.2%, and 50.0% fibo at 1598.53, 1571.25, and 1549.10 respectively. However, the key downside target is the low at 1451.18. The resistance is the high at 1643.07.

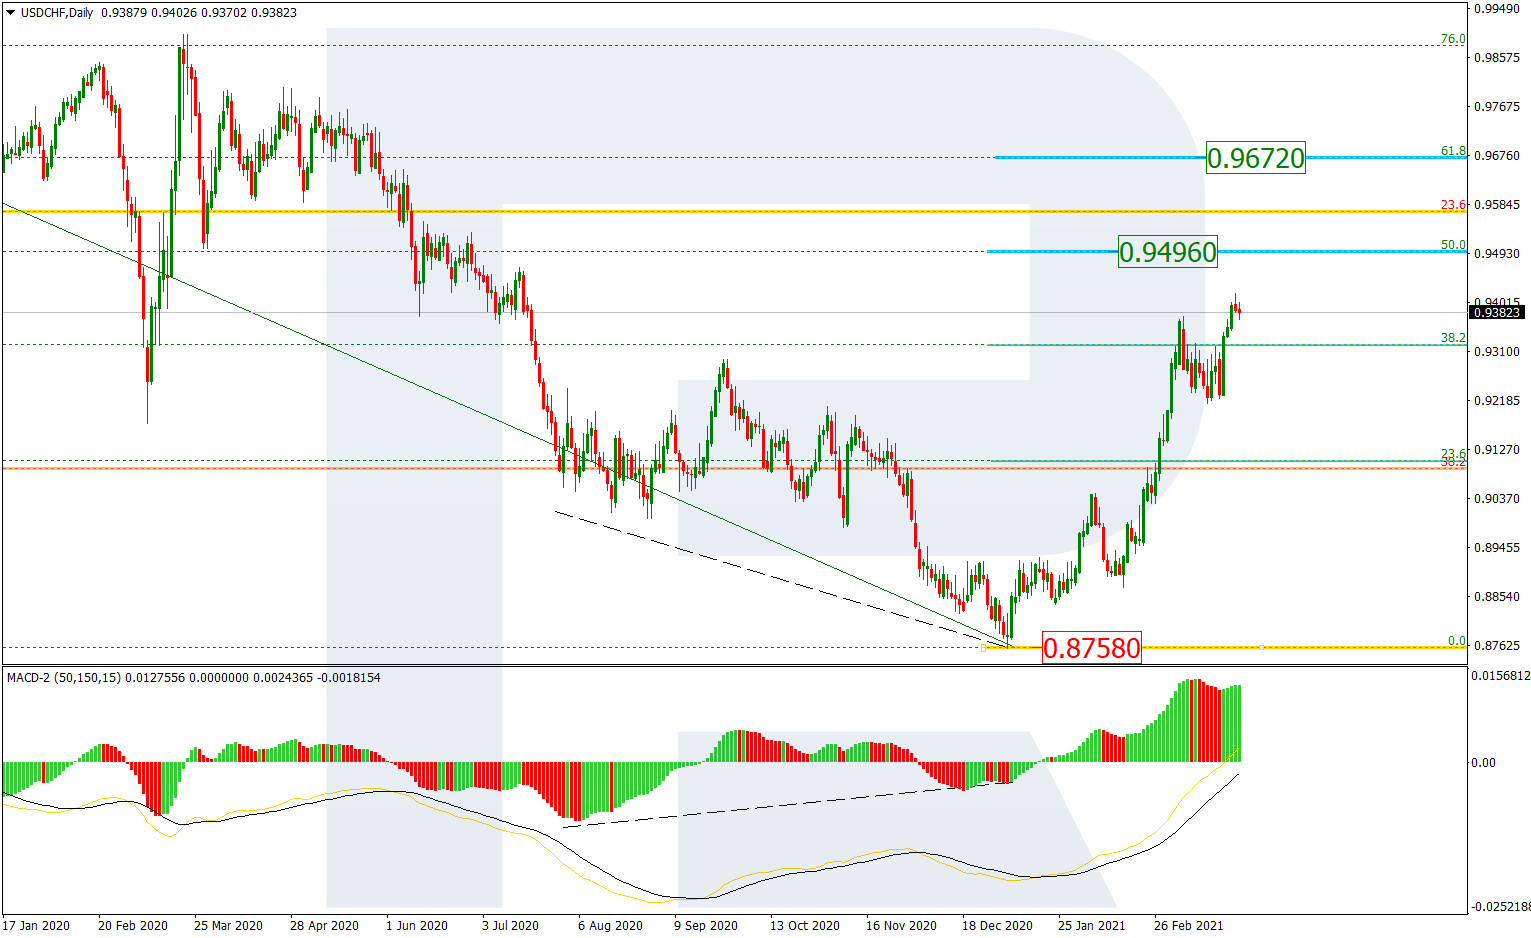
USDCHF, “US Dollar vs Swiss Franc”
In the daily chart, the rising impulse has corrected the previous descending wave by 61.8%. The descending wave may be considered a short-term pullback before a new wave to the upside, which may head towards 76.0% fibo at 0.9982 and the fractal high at 1.0236. The key pressure on the market is coming from 1.0344.
In the H1 chart, the convergence made the pair stop falling at 50.0%, Possibly, the pair may form one more descending impulse to reach 61.8% fibo at 0.9453. However, the main scenario implies a new rising wave towards the high at 0.9901.
