GBPUSD, “Great Britain Pound vs US Dollar”
As we can see in the H4 chart, after a rebound from 38.2% fibo and a local convergence on MACD, GBPUSD is growing towards 23.6% fibo, which may be a signal in favor of a new mid-term rising wave to reach the high at 1.3482. After breaking it, the pair may continue moving towards the long-term 76.0% fibo at 1,3661. However, despite the convergence and the current growth, the asset may yet update the low and reach 50.0% fibo at 1.2445.


The H1 chart shows a more detailed structure of the current pullback after the convergence on MACD. After reaching 23.6% fibo, the pair is consolidating around this level. If later the price breaks this range to the upside, the market may continue growing towards 38.2%, 50.0%, and 61.8% fibo at 1.2983, 1.3078, and 1.3174 respectively. The support is the high at 1.2675.

EURJPY, “Euro vs. Japanese Yen”
As we can see in the H4 chart, after rebounding from the support at 38.2% fibo, EURJPY has returned to 23.6% fibo, which may be a signal in favor of a possible growth. However, as long as the price is moving below the high at 127.08, it’s only an assumption. The asset may reach the long-term 61.8% fibo at 128.65 only after breaking the above-mentioned peak. Despite a quick correctional wave to the upside, the pair may yet start a new decline towards 50.0% fibo at 121.20.

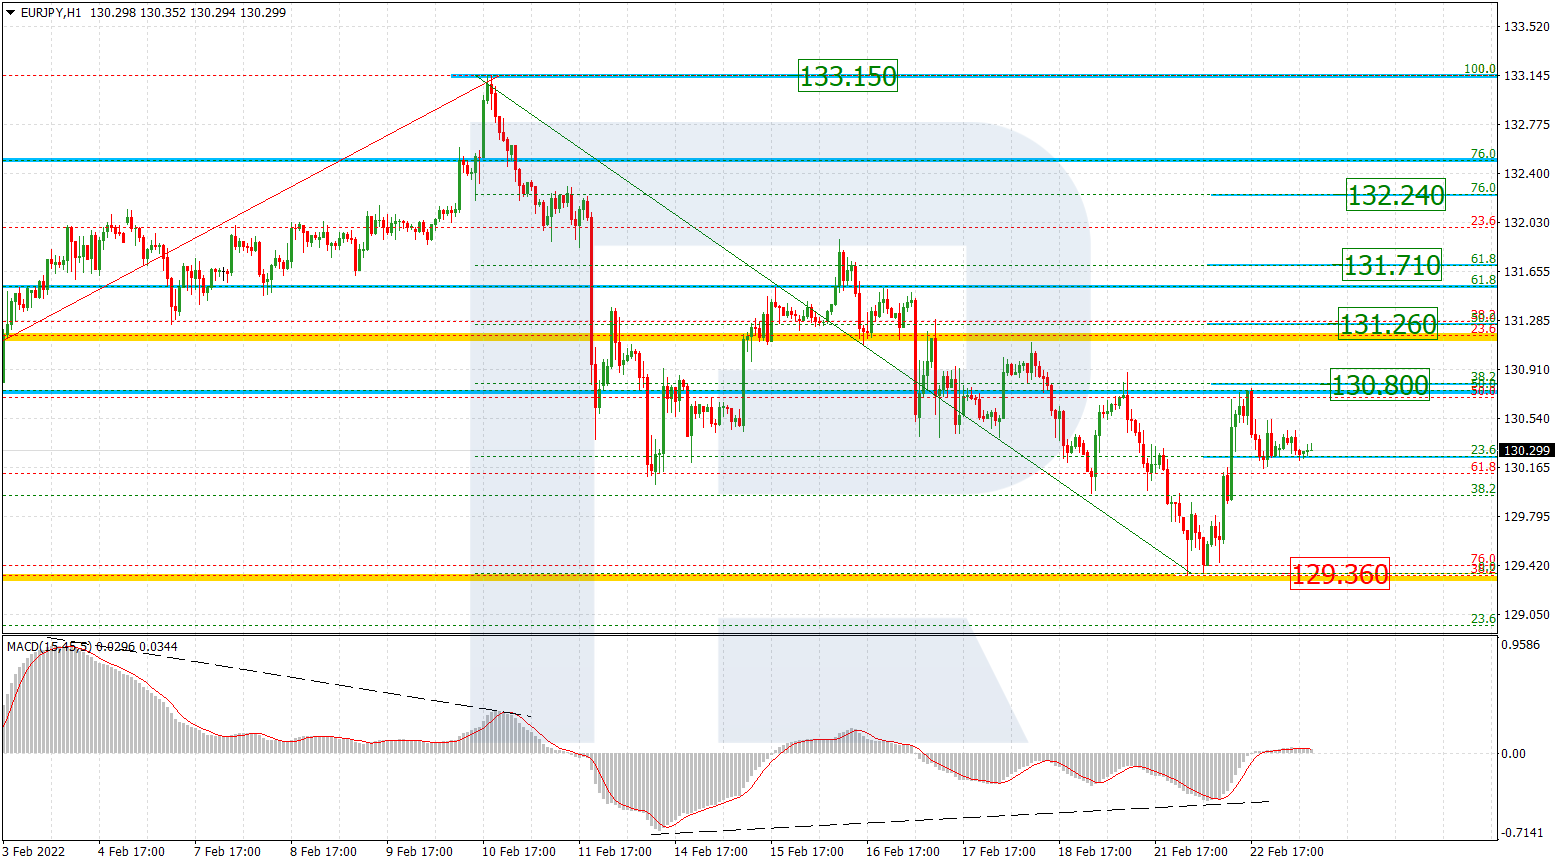
In the H1 chart, the instrument has reached 38.2% fibo after the convergence on MACD. In the future, the pair may form a short-term pullback and then resume growing towards 50.0% and 61.8% fibo at 124.73 and 125.28 respectively. The support is the low at 122.38.