Brent
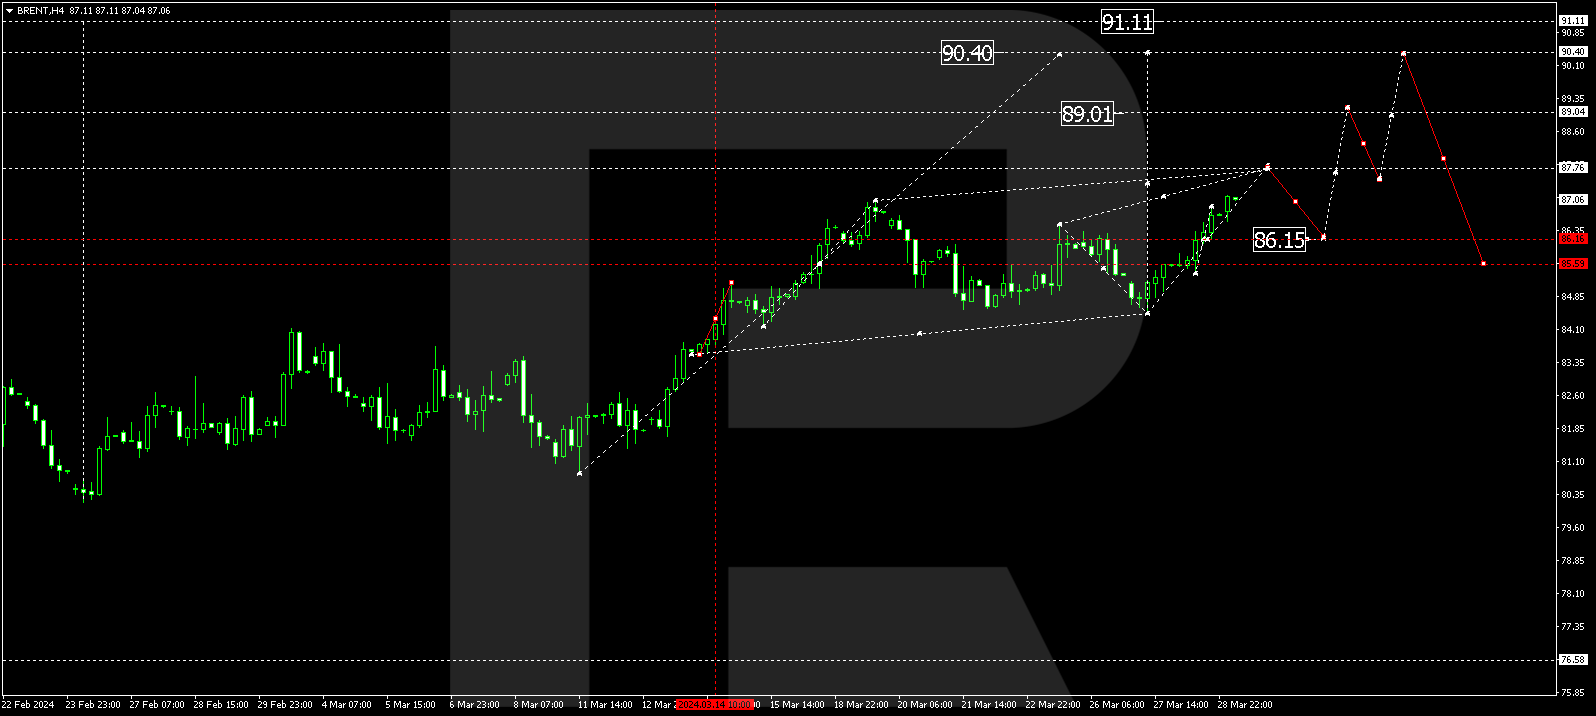
As we can see in the H4 chart, Brent is still moving upwards and may attempt to reach the high 86.63. If this wave fails to break the high and rebounds from it instead, the asset may start a new decline break the low at 65.89 and then continue falling towards long-term 38.2%, 50.0%, and 61.8% fibo at 59.53, 51.20, and 42.86 respectively.


The H1 chart shows that the current rising impulse has reached 61.8% fibo, a breakout of which may lead to a further uptrend towards 76.0% fibo at 81.63 and then the high at 86.63. At the same time, there is divergence on MACD, which may hint at a possible reversal and a new decline to reach the low at 65.89.


Dow Jones
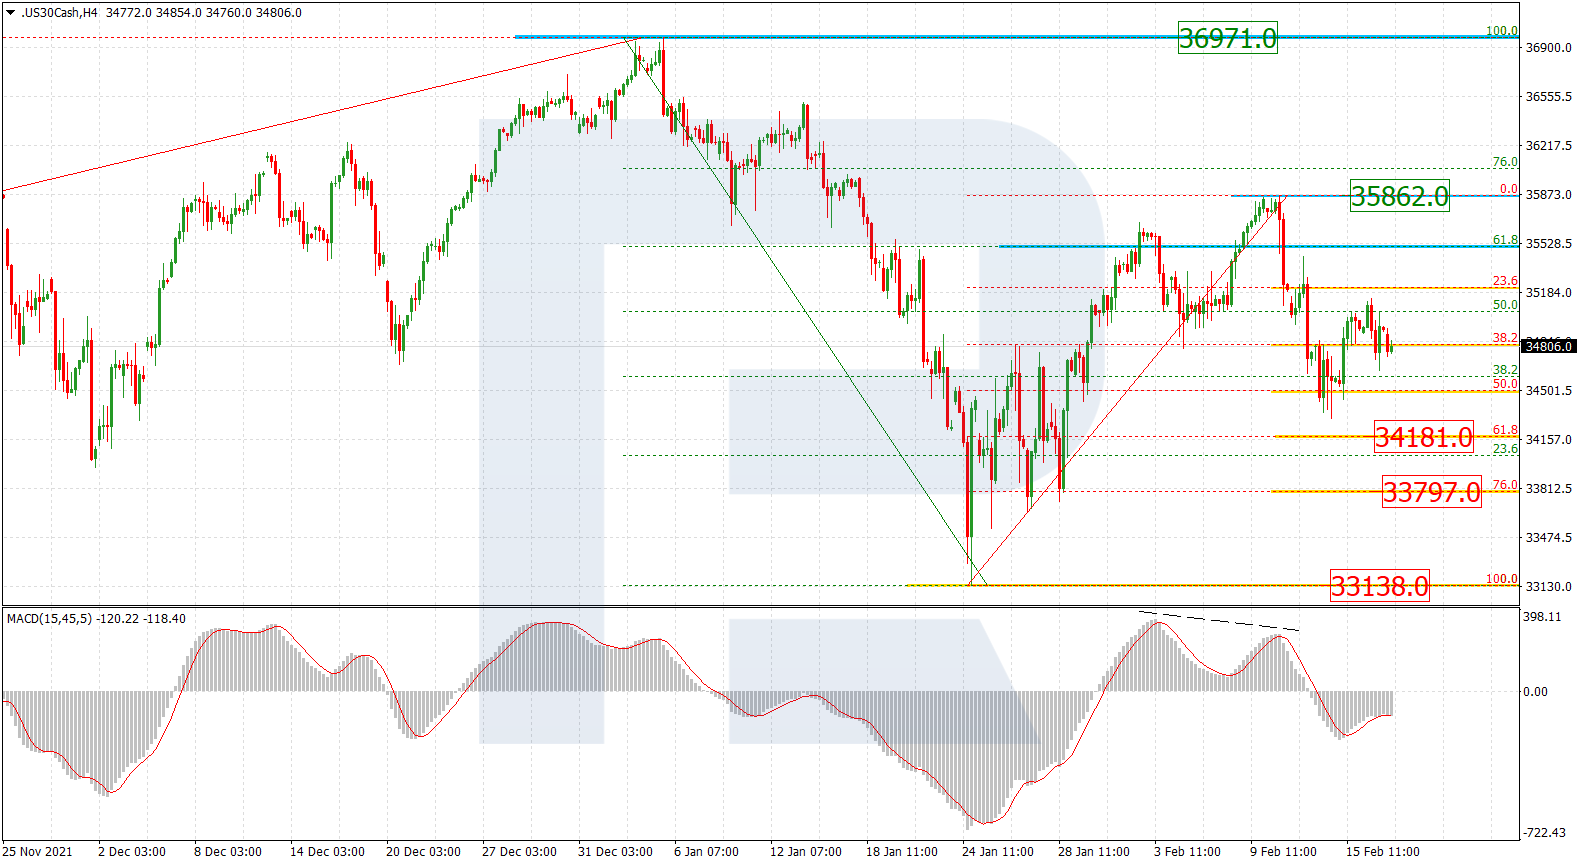
As we can see in the H4 chart, the index is testing the high at 36750.0 and trying to break it. If the asset succeeds, it may continue trading upwards to reach the post-correctional extension area between 138.2% and 161.8% fibo at 37562.0 and 38175.0 respectively. in the short-term, the price may slightly correct to the downside. The support remains at the local low at 33962.0.


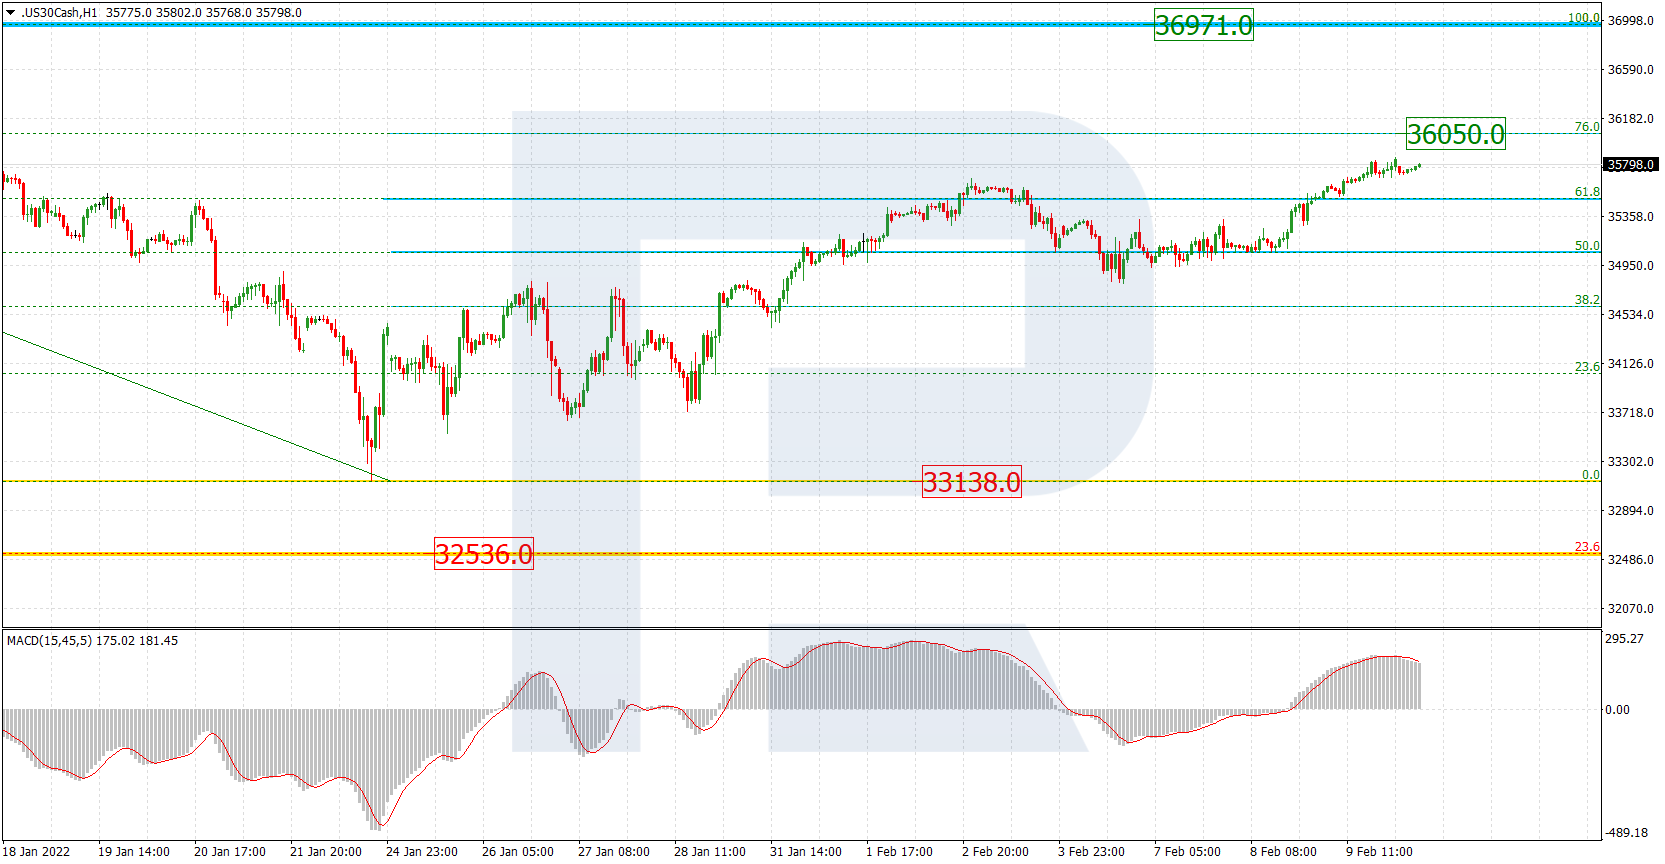
In the H1 chart, there is divergence on MACD, which may hint at a possible pullback. In this case, the correctional targets may be 23.6%, 38.2%, and 50.0% fibo at 36144.0, 35867.0, and 35639.0 respectively. The resistance is the high at 36596.0.

