BTCUSD, “Bitcoin vs US Dollar”
In the H4 chart, after the price had reach the retracement of 38.2%, there was a divergence on MACD, which may indicate a new correction. The key support level is the retracement of 23.6% at 6450.00. After completing the correction and breaking the high at 9089.70, BTCUSD may started a new rising wave to reach the retracement of 50.0% at 10170.00.


In the H1 chart. BTCUSD is trading downwards to reach the retracement of 23.6% at 7810.00. The next downside targets may be the retracement of 38.2%, 50.0%, and 61.8% at 7020.00, 6370.00, and 5735.00.


ETHUSD, “Ethereum vs. US Dollar”
As we can see in the H4 chart, after ETHUSD had updated the previous high, there was a divergence on MACD, which may indicate a possible pullback or a trend reverse. By now, the price has already reached the retracement of 23.6% and may continue trading downwards. However, the mid-term rising tendency may yet continue. A new ascending impulse may be heading to break the high at 288.82 and reach the retracement of 38.2% at 367.00.


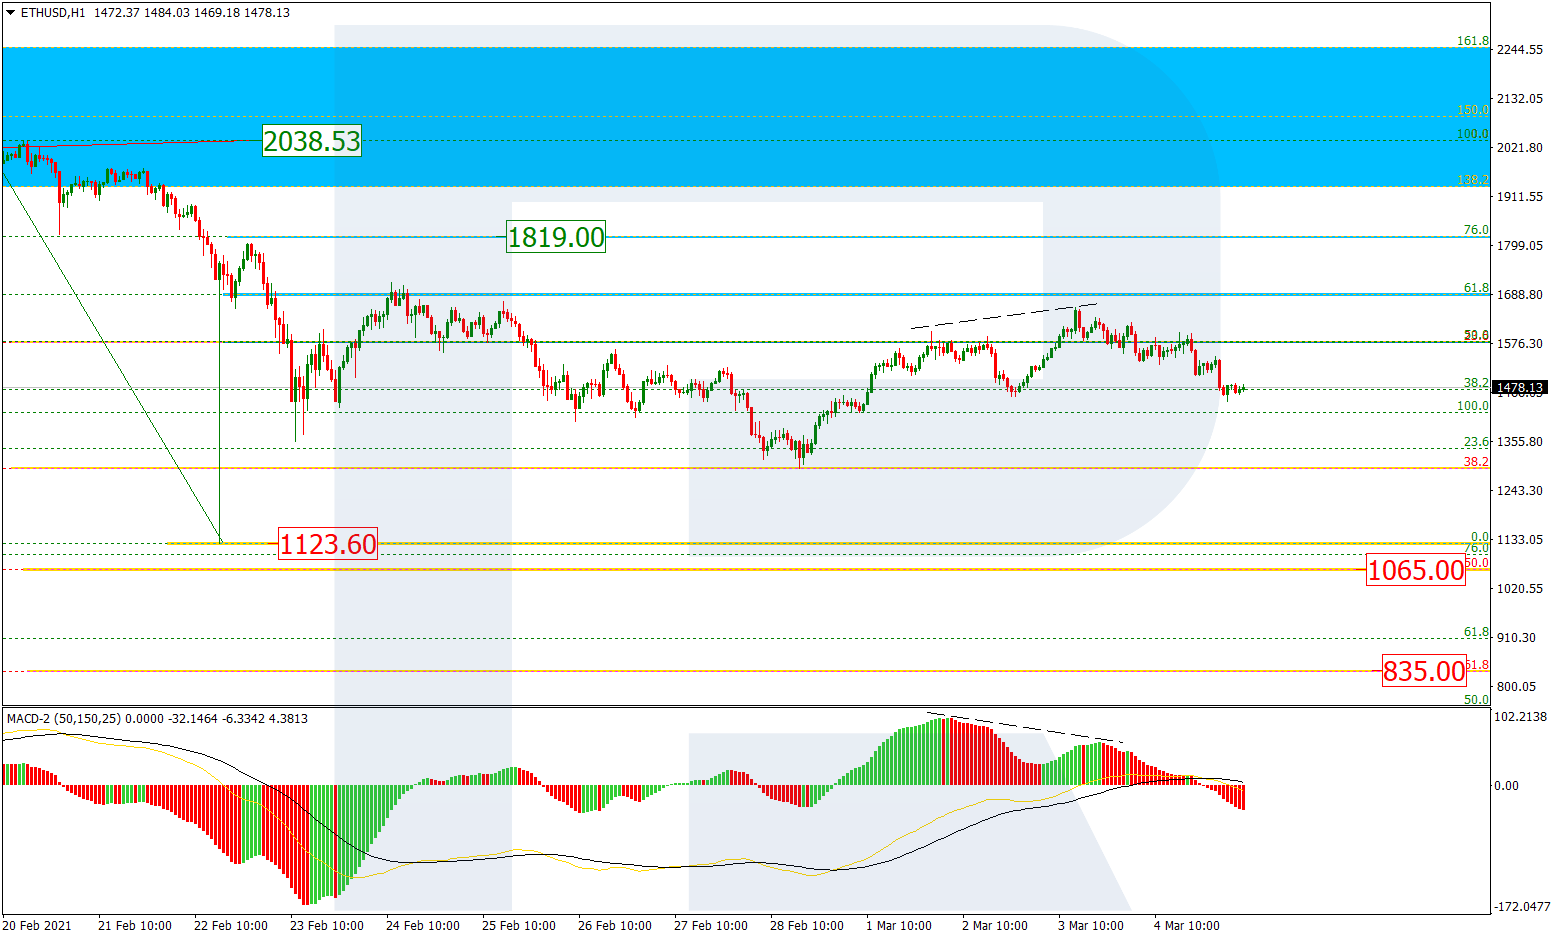
The H1 chart shows the targets of the current descending correction; the closest ones is the retracement of 38.2% at 234.70. The next targets may be the retracements of 50.0%, 61.8%, and 76.0% at 218.07, 201.00, and 180.95 respectively.

