EURUSD, “Euro vs US Dollar”
EURUSD has failed to continue the descending wave; it reached 1.1414 (the upside border of the range) once again and then formed another descending impulse. Right now, it is trading above 1.1360 (the downside border of the range). Possibly, the pair may break the border and resume moving downwards with the short-term target at 1.1323.


GBPUSD, “Great Britain Pound vs US Dollar”
GBPUSD continues falling towards 1.3232. After that, the instrument may start a new growth to reach 1.3290 and then form one more descending structure with the target at 1.3175.

USDCHF, “US Dollar vs Swiss Franc”
USDCHF has reached 0.9930; right now, it is forming another ascending structure. Possibly, today the pair may reach 0.9998. Later, the market may form a new consolidation range, break it upwards, and then continue growing with the short-term target at 1.0016.

USDJPY, “US Dollar vs Japanese Yen”
After breaking 111.22 upwards, USDCHF formed the consolidation channel around 111.37 and broken it upwards as well. Today, the pair may fall to return to 111.37 and then form a new ascending structure with the short-term target at 111.78.

AUDUSD, “Australian Dollar vs US Dollar”
AUDUSD is trading downwards with the target at 0.7030. Today, the pair may reach 0.7040 and then start a new correction towards 0.7118. Later, the market may resume trading inside the downtrend with the above-mentioned target.

USDRUB, “US Dollar vs Russian Ruble”
USDRUB is consolidating around 65.77. Possibly, today the pair may expand the range towards 66.20 and then fall to break 65.40. After that, the instrument may continue trading inside the downtrend with the target at 64.80.

XAUUSD, “Gold vs US Dollar”
Gold is trading downwards. Possibly, the pair may fall with the short-term target at 1311.57. Later, the market may form a new ascending structure to test 1322.30 from below and then resume moving downwards to reach the key target of the first descending wave at 1297.80.

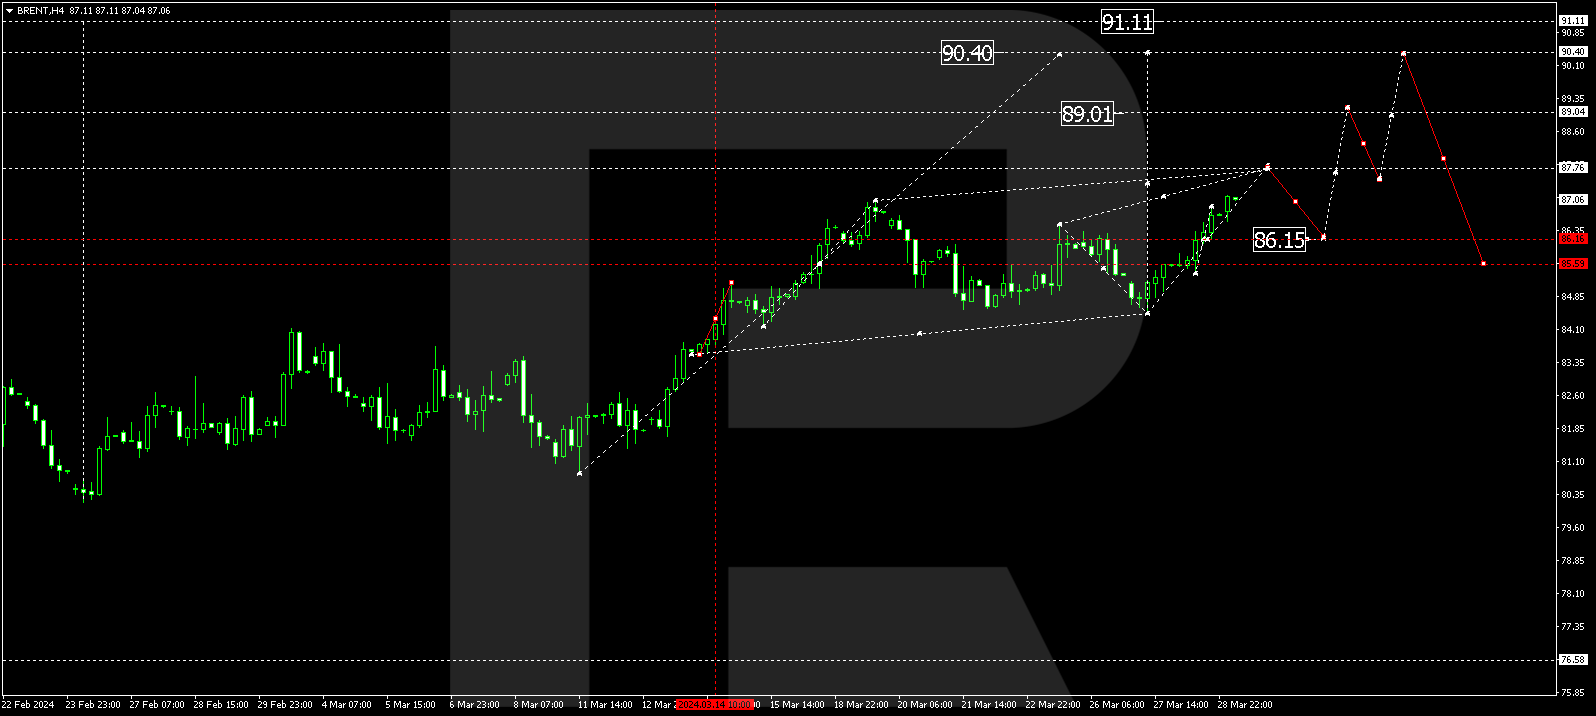
BRENT
Brent is still trading above 65.80. Possibly, the pair may form a new ascending structure towards 67.18 and then resume moving downwards to reach 65.80, thus forming a new consolidation range. If later the price breaks range to the upside, the instrument may continue growing to reach 68.40; if to the downside – resume trading inside the downtrend with the target at 63.95.