Forex Technical Analysis & Forecast 01.08.2019 (EURUSD, GBPUSD, USDCHF, USDJPY, AUDUSD, USDRUB, GOLD, BRENT)
EURUSD, “Euro vs US Dollar”
After plummeting and reaching the predicted target at 1.1075, EURUSD has formed another downside continuation patter around 1.1080; right now, it is falling to reach 1.1025. Later, the market may start a new correction to return to 1.1080.


GBPUSD, “Great Britain Pound vs US Dollar”
GBPUSD has rebounded from 1.2240; right now, it is still falling towards 1.1965. Today, the pair may consolidate around 1.2134. If later the price breaks this range to the downside at 1.2077, the instrument may continue trading inside the downtrend with the target at 1.1965; if to the upside at 1.2150 – start a new correction to reach 1.2200 and then form a new descending structure towards the above-mentioned target.

USDCHF, “US Dollar vs Swiss Franc”
USDCHF has broken 0.9944. Possibly, today the pair may test 0.9945 from above and then form one more ascending structure with the first target at 1.0000. After that, the instrument may start another correction towards 0.9900.

USDJPY, “US Dollar vs Japanese Yen”
USDJPY has expanded the range up to 109.30 and almost formed Divergent Triangle pattern. Today, the pair may fall to break 108.90 and then continue trading downwards with the first target at 108.50.

AUDUSD, “Australian Dollar vs US Dollar”
After forming the consolidation range around 0.6904, AUDUSD has broken it to the downside and may extend this wave towards the short-term target at target at 0.6755. Possibly, today the pair may form one more ascending structure towards 0.6863 and then fall to break 0.6820. Later, the market may continue trading downwards with the target at 0.6780.

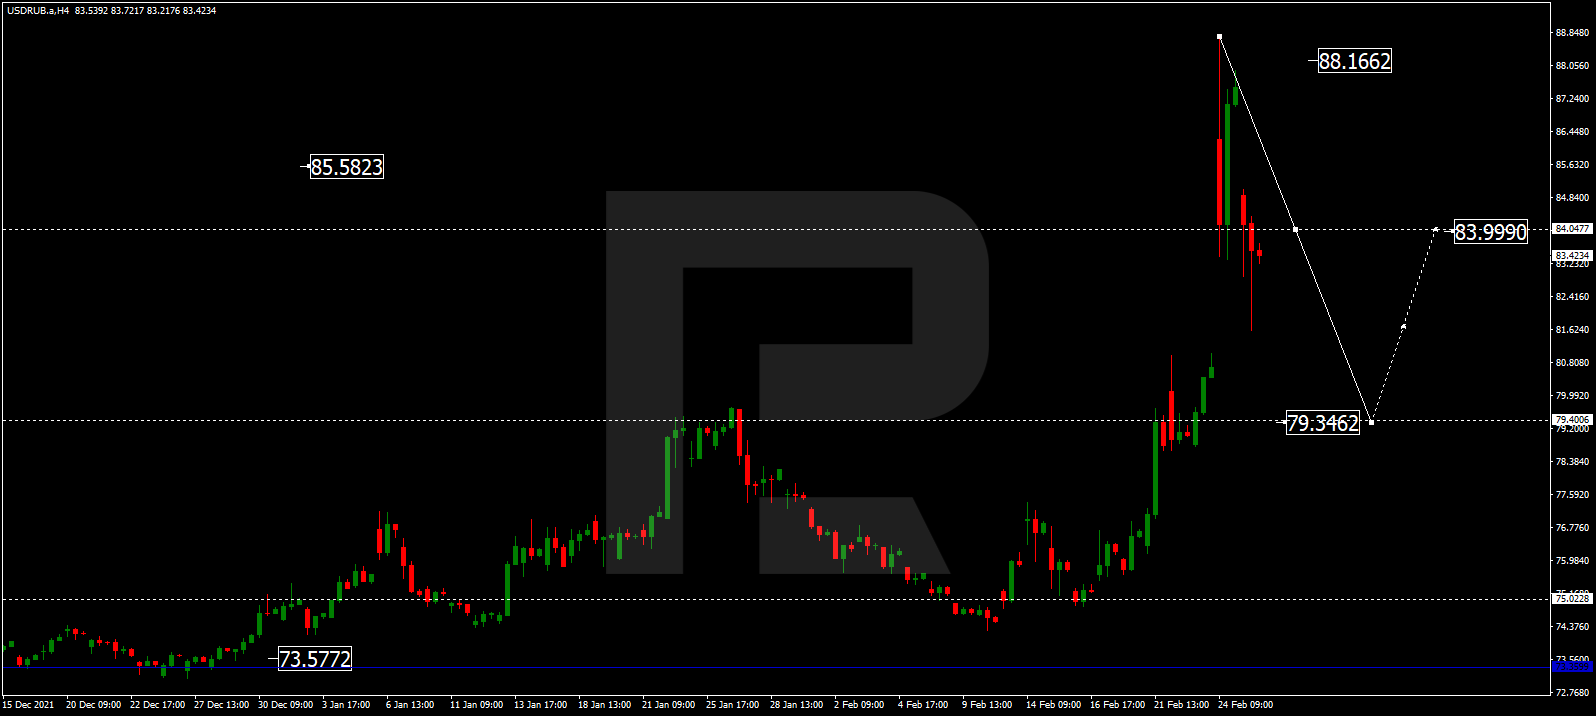
USDRUB, “US Dollar vs Russian Ruble”
USDRUB is still consolidating around 63.20. If the price breaks this range to the upside at 63.50, the instrument may continue the correction towards 63.88; if to the downside at 63.14 – continue trading inside the downtrend with the target at 62.40.
XAUUSD, “Gold vs US Dollar”
Gold has broken 1414.00 to the downside and may continue forming the third wave with the short-term target at 1392.80. After that, the instrument may start a new growth to return to 1414.00 and then form the fifth descending wave towards 1376.00.

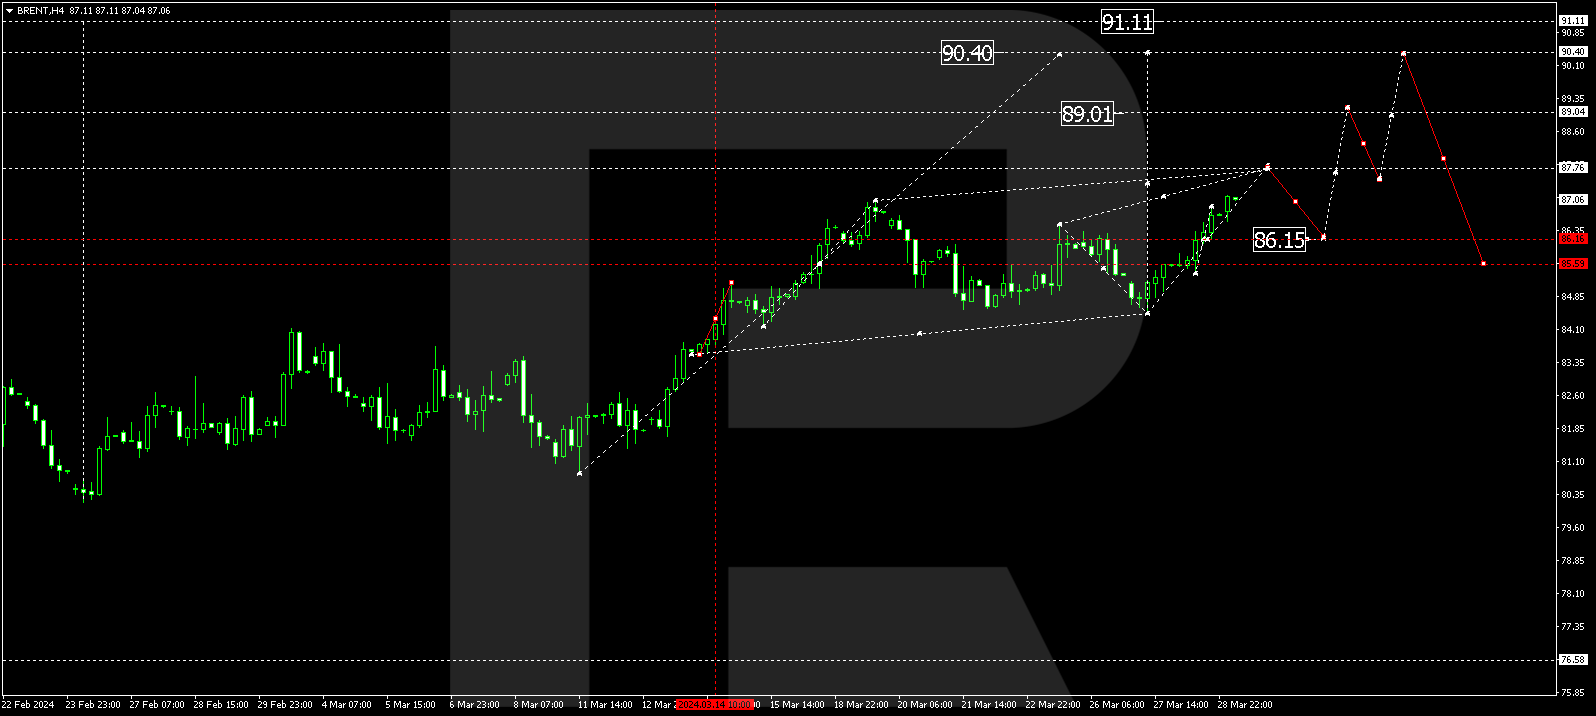
BRENT
Brent has returned to 64.25. Possibly, the pair may form one more ascending structure with the short-term target at 65.90. Later, the market may be corrected to reach 64.50 and then resume trading inside the uptrend with the first target at 67.70.