EURUSD, “Euro vs US Dollar”
After finishing the ascending wave at 1.1928, EURUSD is forming a narrow consolidation range around this level. Possibly, the pair may break the range to the upside and form one more ascending wave with the short-term target at 1.1980.


GBPUSD, “Great Britain Pound vs US Dollar”
After completing the ascending wave at 1.3918 along with the correction towards 1.3848, GBPUSD is growing to break 1.4000. Later, the market may continue trading upwards with the short-term target at 1.4123.

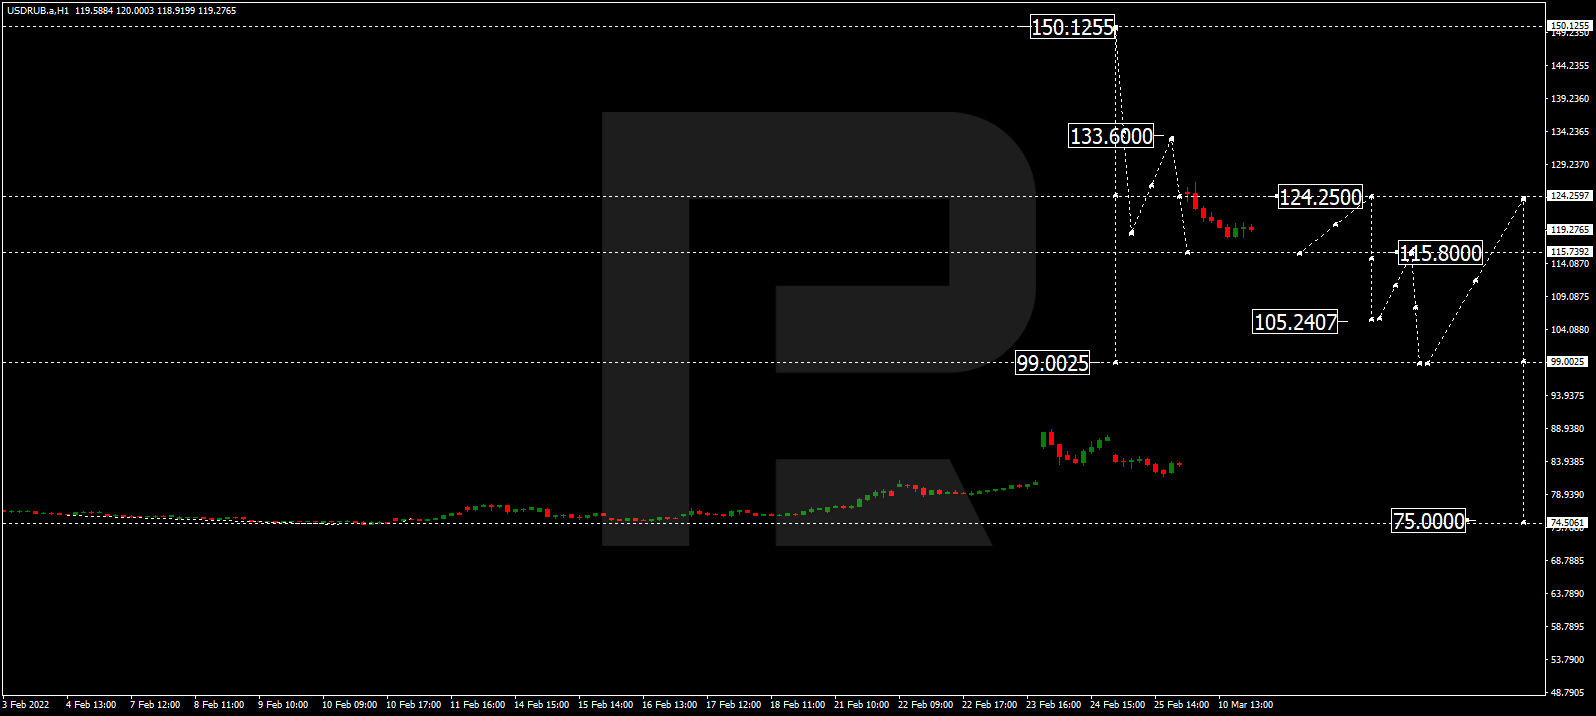
USDRUB, “US Dollar vs Russian Ruble”
USDRUB continues falling towards 73.60. After that, the instrument may start consolidating. If later the price breaks this range to the downside, the market may form a new descending structure with the target at 73.40 or even 73.14.
USDJPY, “US Dollar vs Japanese Yen”
USDJPY is still falling towards 108.27. After that, the instrument may break this level to the downside and continue trading downwards with the short-term target at 107.70.

USDCHF, “US Dollar vs Swiss Franc”
USDCHF has completed the correctional structure towards 0.9322; right now, it is forming another descending wave with the short-term target at 0.9191.

AUDUSD, “Australian Dollar vs US Dollar”
After rebounding from 0.7620, AUDUSD is expected to grow towards 0.7797. Later, the market may resume trading downwards with the target at 0.7600.

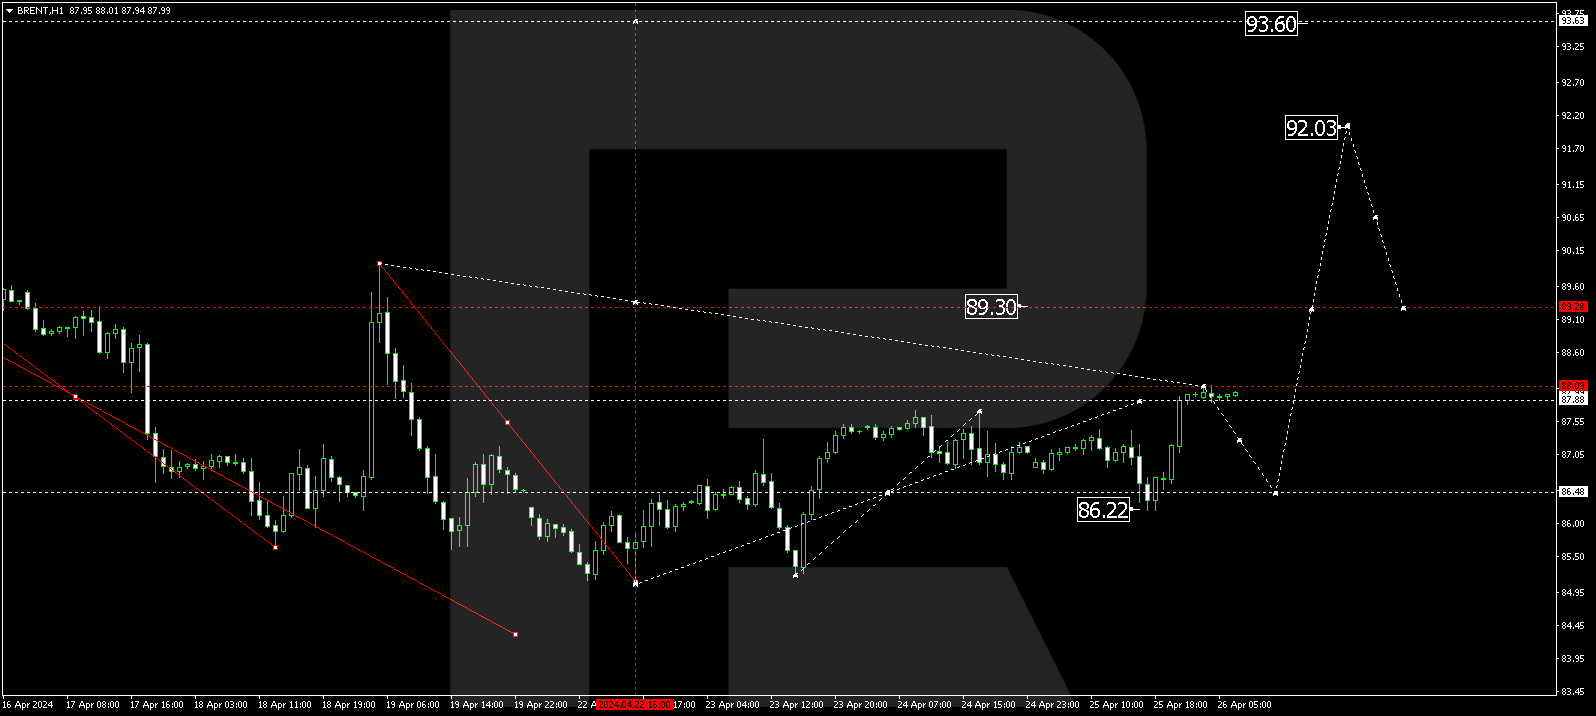
BRENT
After finishing the correction at 66.38, Brent is growing to reach 68.68. After that, the instrument may break this level to the upside and form one more ascending structure with the target at 70.70.
XAUUSD, “Gold vs US Dollar”
After breaking 1724.65, Gold is still growing towards 1739.44 and may later correct to test 1724.65 from above. After that, the instrument may start another growth with the target at 1755.03.

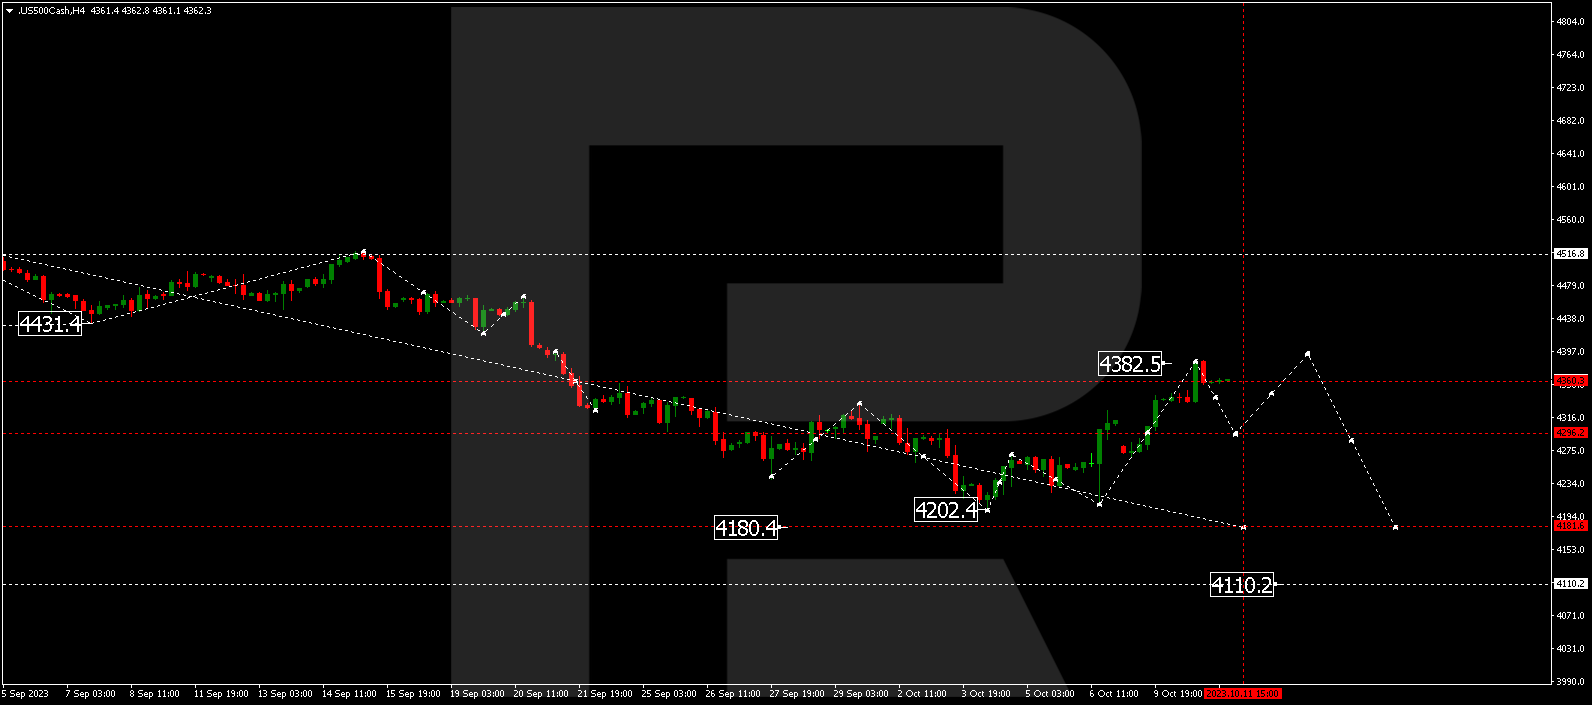
S&P 500
The S&P index is growing to reach 3926.0. Later, the market may correct towards 3860.0 and resume trading upwards with the target at 3973.0 or even 4000.0.