Forex Technical Analysis & Forecast 20.03.2023
EURUSD, “Euro vs US Dollar”
The currency pair has completed a wave of correction to 1.0687. At the moment, a consolidation range is forming around this level. The price is likely to escape the range downwards and continue the wave to 1.0516. The target is local. After the quotes reach the level, a link of growth to 1.0600 should follow, and after that, we might see a decline to 1.0350.


GBPUSD, “Great Britain Pound vs US Dollar”
The currency pair has performed a structure of growth to 1.2200. Today the market is forming a consolidation range under this level. With an escape from the range downwards, the price might develop a wave of decline to 1.2085. Then we might see growth to 1.2140 and a new decline to 1.1990.


USDJPY, “US Dollar vs Japanese Yen”
The currency pair has completed a wave of decline to 131.55. Today the market is forming a consolidation range above this level. With an escape from the range downwards, the price is likely to drop to 130.90. With an escape upwards, a link of growth to 134.44 might develop. After the quotes reach this level, a new structure of decline to 130.90 should follow.


USDCHF, “US Dollar vs Swiss Franc”
The currency pair continues developing a consolidation range above 0.9266. Later the range might expand downwards to 0.9222. Then we might see growth to 0.9353 and a link of decline to 0.9266.


AUDUSD, “Australian Dollar vs US Dollar”
The currency pair has completed a structure of a wave of growth to 0.6726. Today the market continues forming a consolidation range under this level. We expect the price to escape it downwards and continue the decline to 0.6645, from where a wave of growth to 0.6565 might start developing.


BRENT
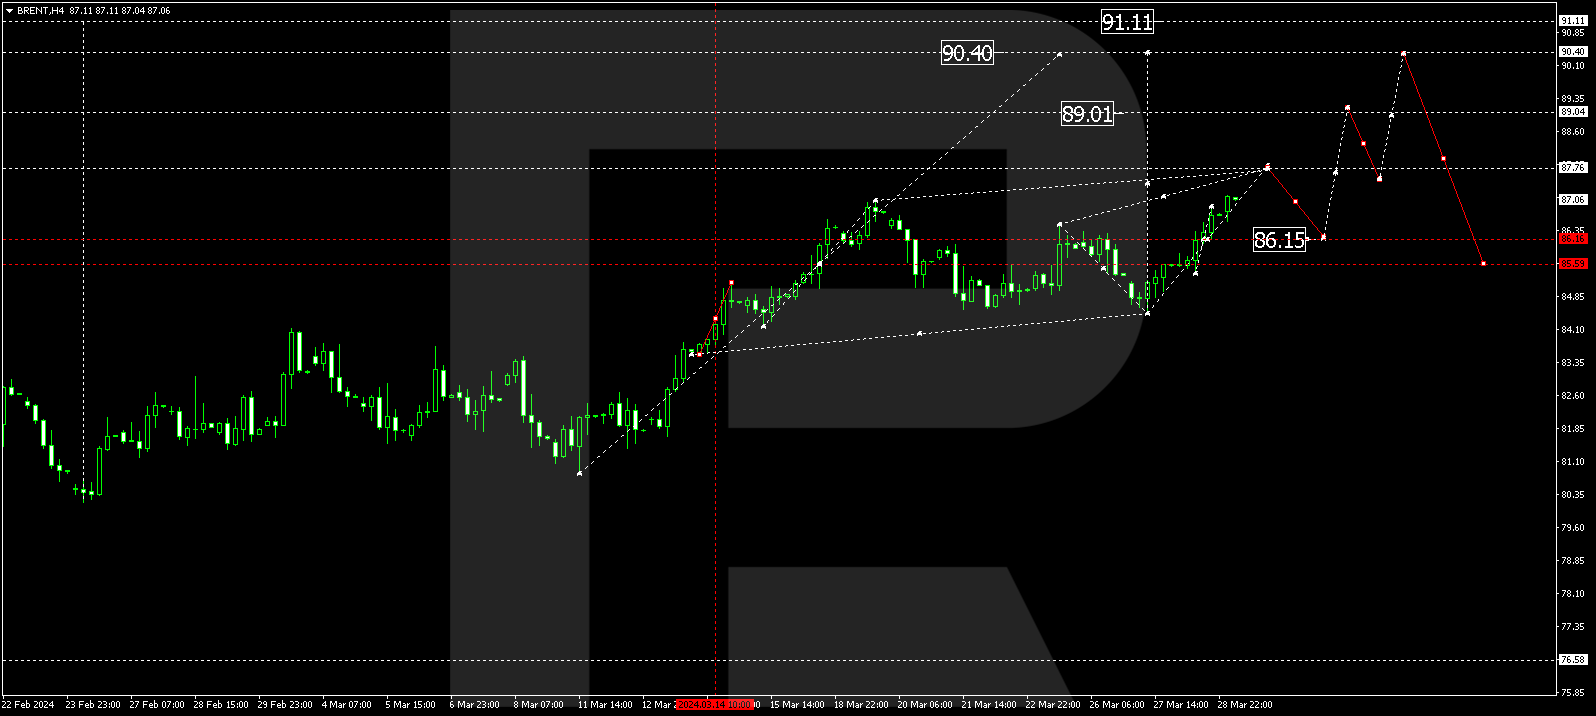
Brent continues developing a structure of decline to 70.28. After the price reaches this level, it might correct to 78.40. Then a decline to 70.00 should follow.


XAUUSD, “Gold vs US Dollar”
Gold has completed a wave of growth to 1987.77. Today a consolidation range might form under this level. With an escape from the range downwards, the price might continue a declining wave of correction to 1893.40. After it reaches the level, growth to 1942.00 might follow.


S&P 500
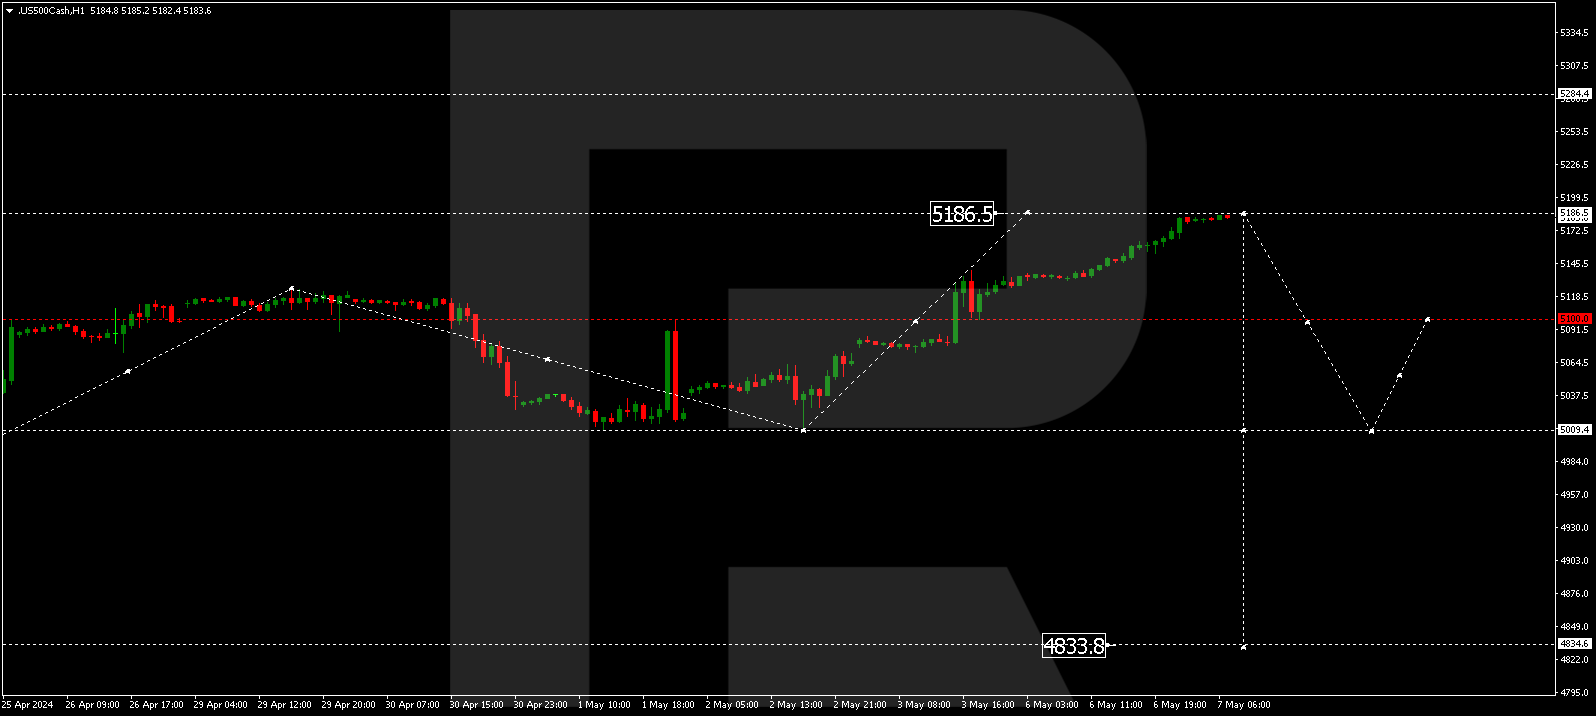
The stock index has completed a wave of growth to 3976.0. Today the market is developing a structure of decline to 3873.5. Then growth to 3925.0 should follow. And next, we might see a decline to 3740.5, from where the wave might continue to 3600.0.

