EURUSD, “Euro vs US Dollar”
EURUSD has reached 1.1400 and completed the ascending wave. Possibly, today the pair may form the first descending impulse towards 1.1374 and then start a new correction to reach 1.1388. Later, the market may resume moving downwards to break 1.1374 and then continue falling with the first target at 1.1322.


GBPUSD, “Great Britain Pound vs US Dollar”
GBPUSD has finished the ascending structure. Today, the pair may form the first descending impulse towards 1.3210. After that, the instrument may start a new correction to reach 1.3245 and then resume trading downwards with the target at 1.3130.

USDCHF, “US Dollar vs Swiss Franc”
USDCHF is still consolidating near the lows. Possibly, today the pair may form a new ascending structure to break 1.0022 and then continue growing with the first target at 1.0058.

USDJPY, “US Dollar vs Japanese Yen”
USDJPY is moving downwards. Today, the pair may reach 110.34 and then start a new correction towards 110.60. Later, the market may resume trading inside the downtrend with the first target at 109.97.

AUDUSD, “Australian Dollar vs US Dollar”
AUDUSD is trading upwards; it has tested 0.7194 once again. Possibly, the pair may resume trading inside the downtrend with the first target at 0.7030.

USDRUB, “US Dollar vs Russian Ruble”
USDRUB has expanded its consolidation range upwards and almost formed the Divergent Triangle pattern to reach 65.85. Possibly, today the pair may form one more descending structure towards 65.45. If later the price breaks 65.85 to the upside, the instrument may be corrected to reach 66.20; if 65.45 to the downside – resume trading inside the downtrend with the target at 64.80.

XAUUSD, “Gold vs US Dollar”
Gold is trading upwards. Possibly, the pair may reach 1333.84 and then resume moving downwards to break 1320.70 and then continue falling with the short-term target at 1310.83.

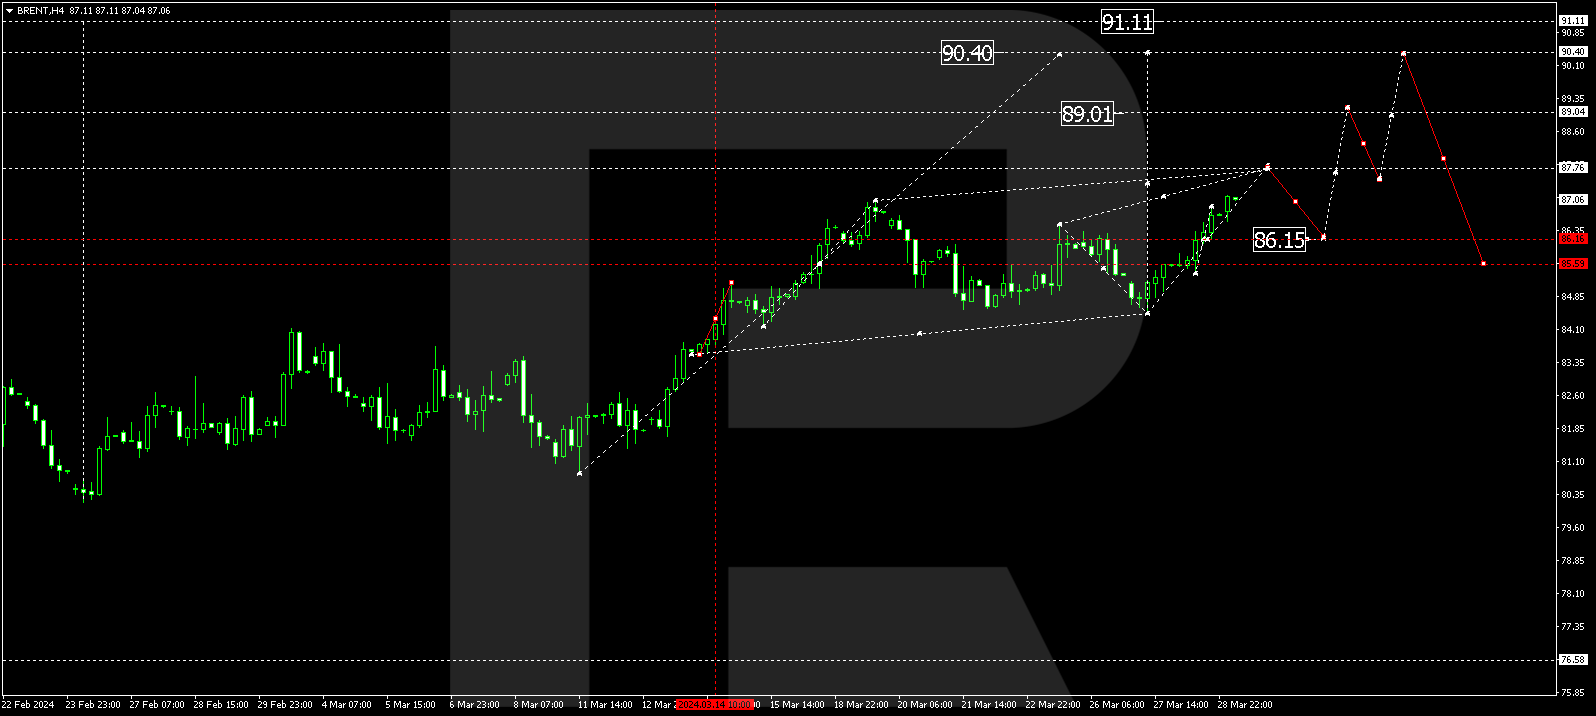
BRENT
Brent has returned to 65.55. Today, the pair may start a new decline towards 63.80 and then form a new ascending structure to test 65.55 from below. Later, the market may continue falling with the target at 63.50.