EURUSD, “Euro vs US Dollar”
As we can see in the daily chart, having returned to test 1.0770 from below, EURUSD is forming a new descending structure towards 1.0340 and may later correct up to 1.0440 at least. After that, the instrument may resume trading downwards with the target at 1.0207 or even extend this structure down to 1.0000.


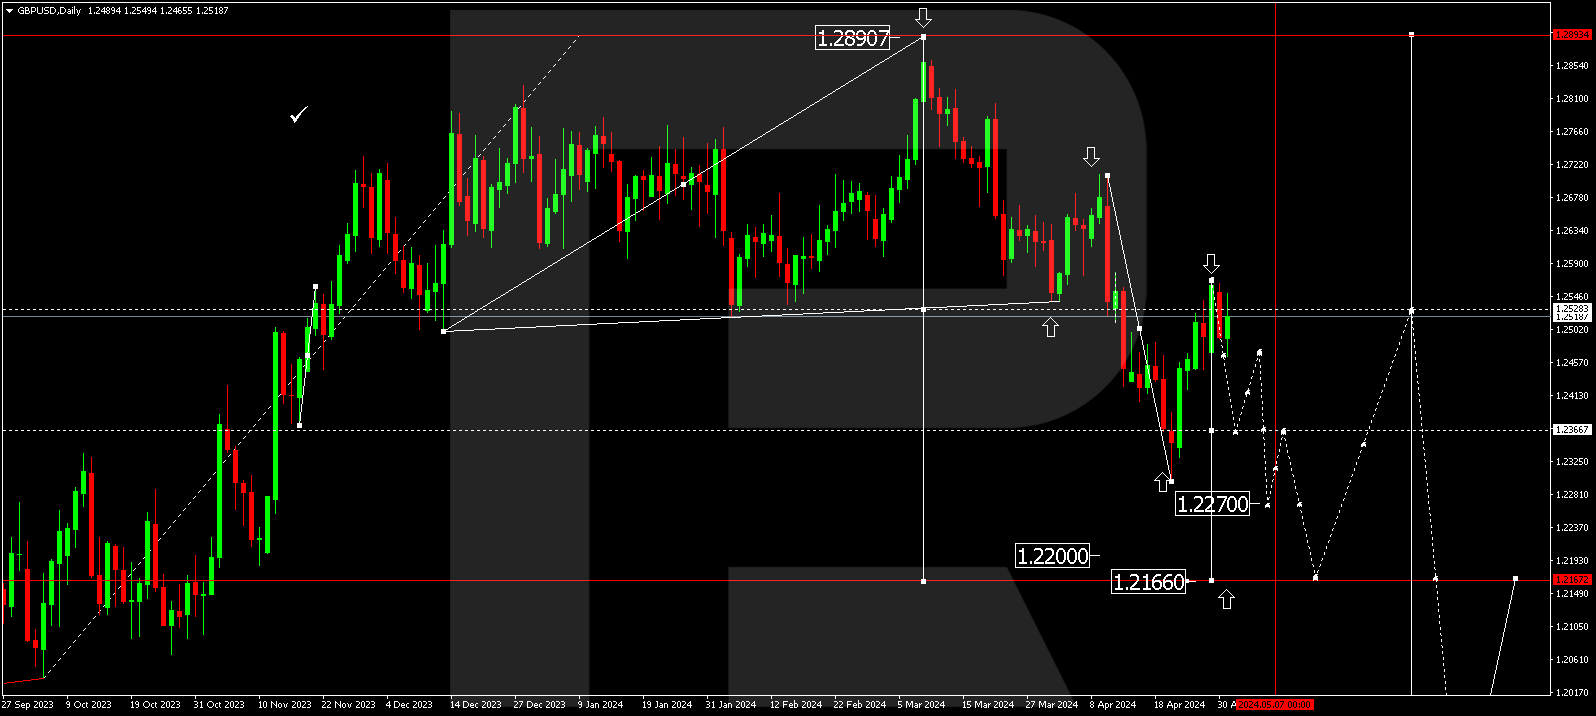
GBPUSD, “Great Britain Pound vs US Dollar”
In the daily chart, GBPUSD is forming a new descending wave towards 1.1838 and may later correct up to 1.2020 at least. After that, the instrument may start a new decline with the target at 1.1400 or even extend this structure down to 1.1111.

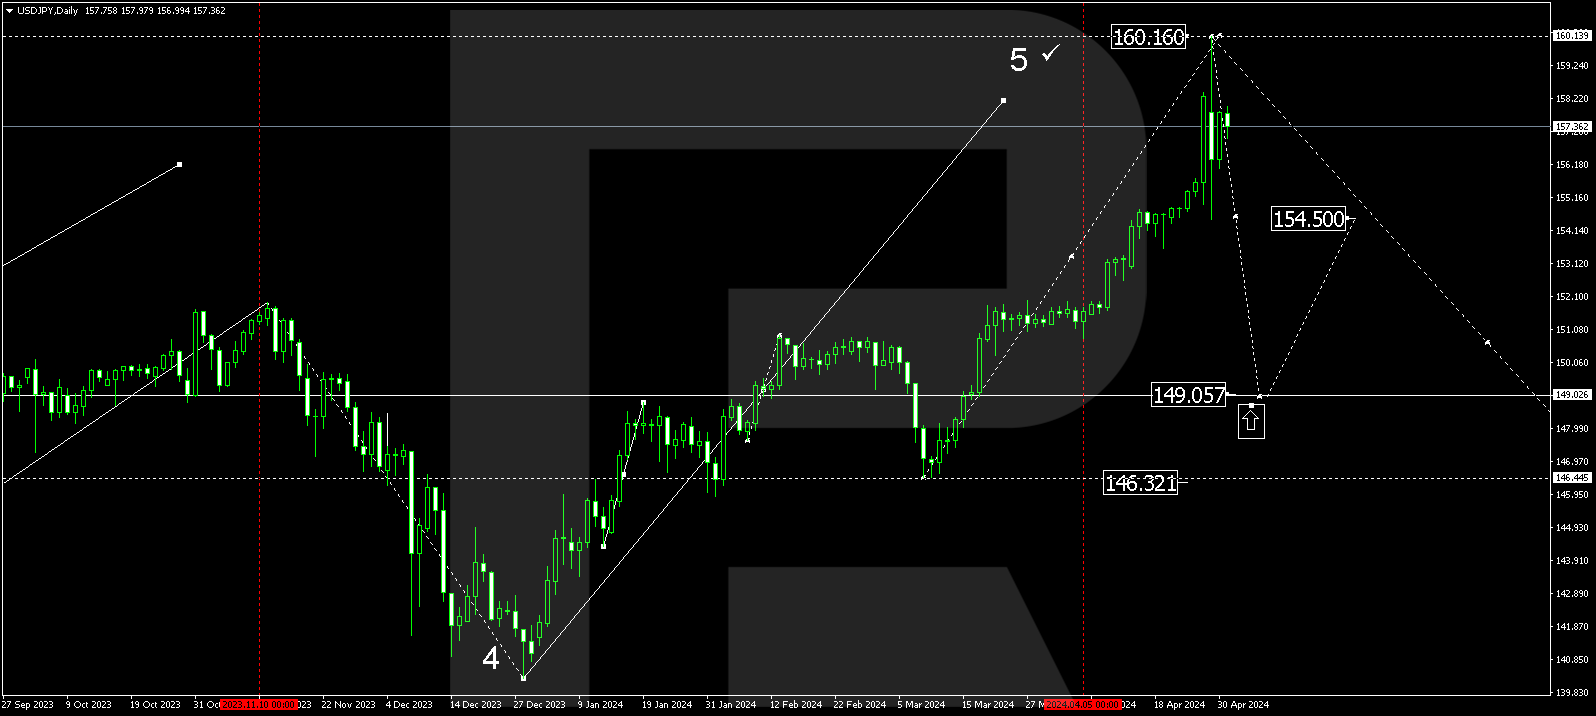
USDJPY, “US Dollar vs Japanese Yen”
In the daily chart, having completed the ascending wave at 136.99, USDJPY is forming the first structure of a new descending wave to reach 134.27. Later, the market may correct up to 135.80 and then resume falling with the target at 131.29 or even extend this structure down to 125.40.

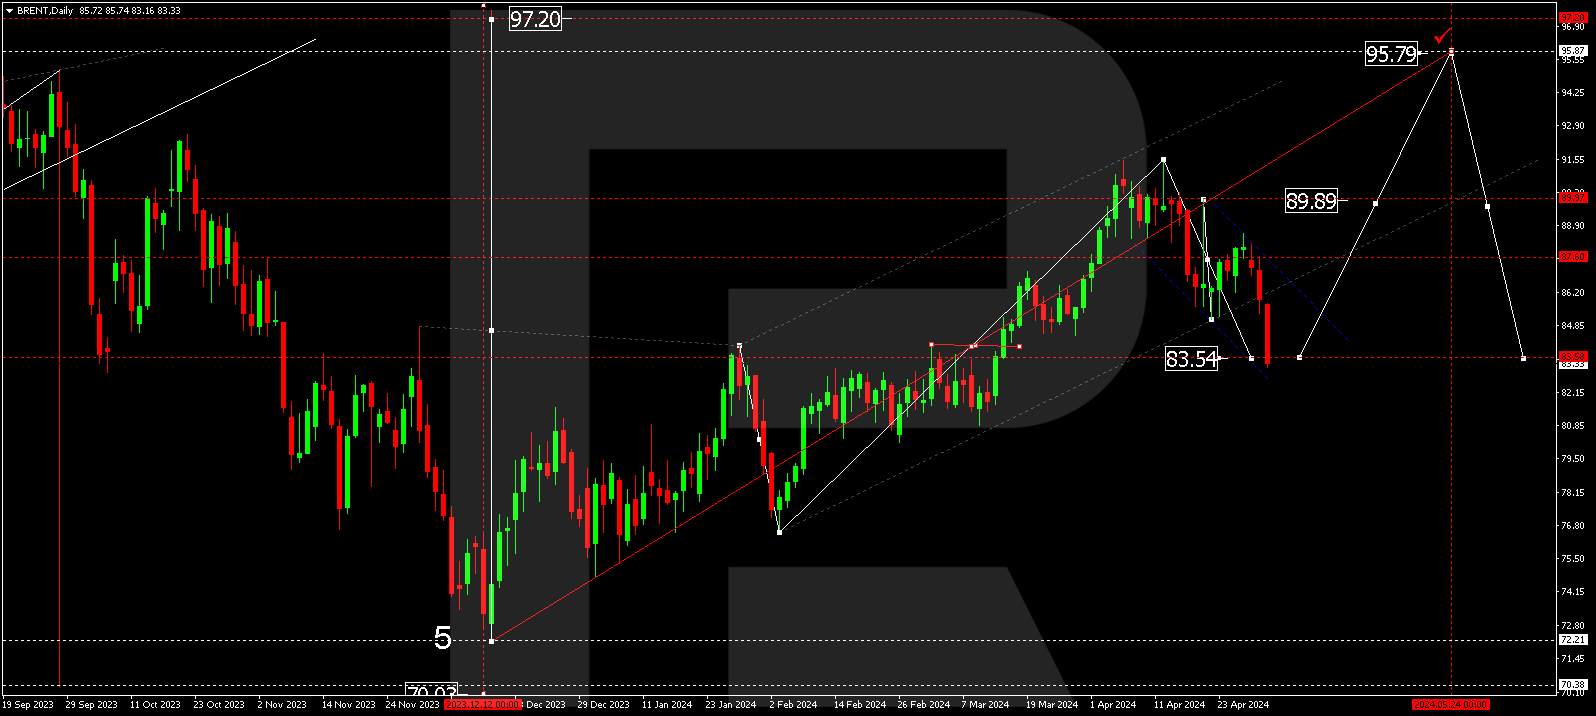
BRENT
As we can see in the daily chart, after finishing the correction at 107.30, Brent is forming another ascending wave towards 119.30. Later, the market may break the latter level and continue growing with the target at 128.00 or even extend this structure up to 132.10.

XAUUSD, “Gold vs US Dollar”
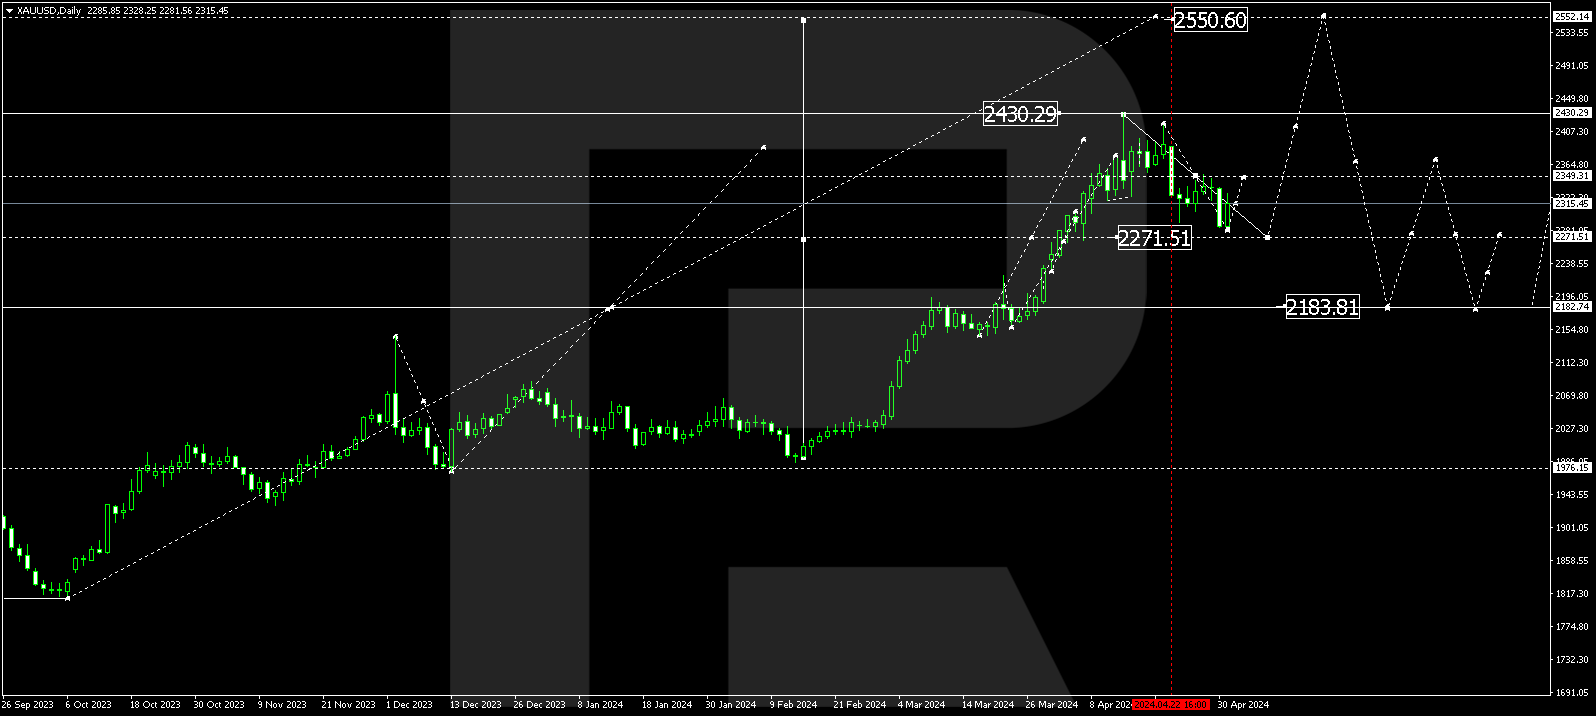
In the daily chart, Gold is forming a new descending wave with the target at 1765.00 and may later correct up to 1812.00. After that, the instrument may resume falling to reach 1740.00 or even extend this structure down to 1700.00.

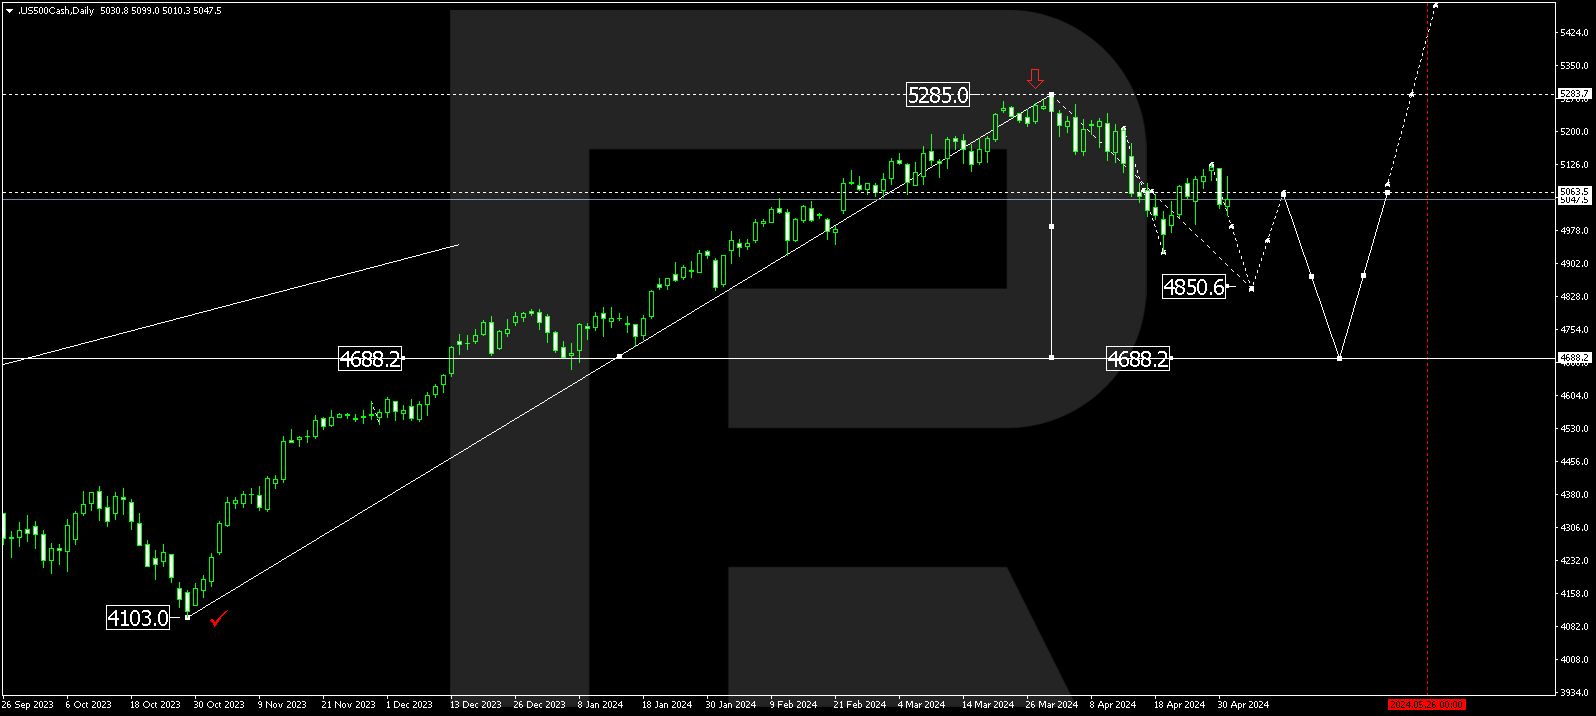
S&P 500
In the daily chart, having reached the predicted downside target at 3700.0, the S&P index is expected to correct up to 4166.6; by now, it has completed the first ascending wave at 3949.0 and is currently correcting down to 3722.0. After that, the instrument may resume trading upwards with the short-term target at 4070.0.
