EURUSD, “Euro vs US Dollar”
As we can see in the daily chart, after reaching the predicted downside target at 0.9554, EURUSD is forming the first ascending structure towards 0.9954. Later, the market may resume trading downwards to reach the key target at 0.9388 and then start a new growth towards 1.0360.


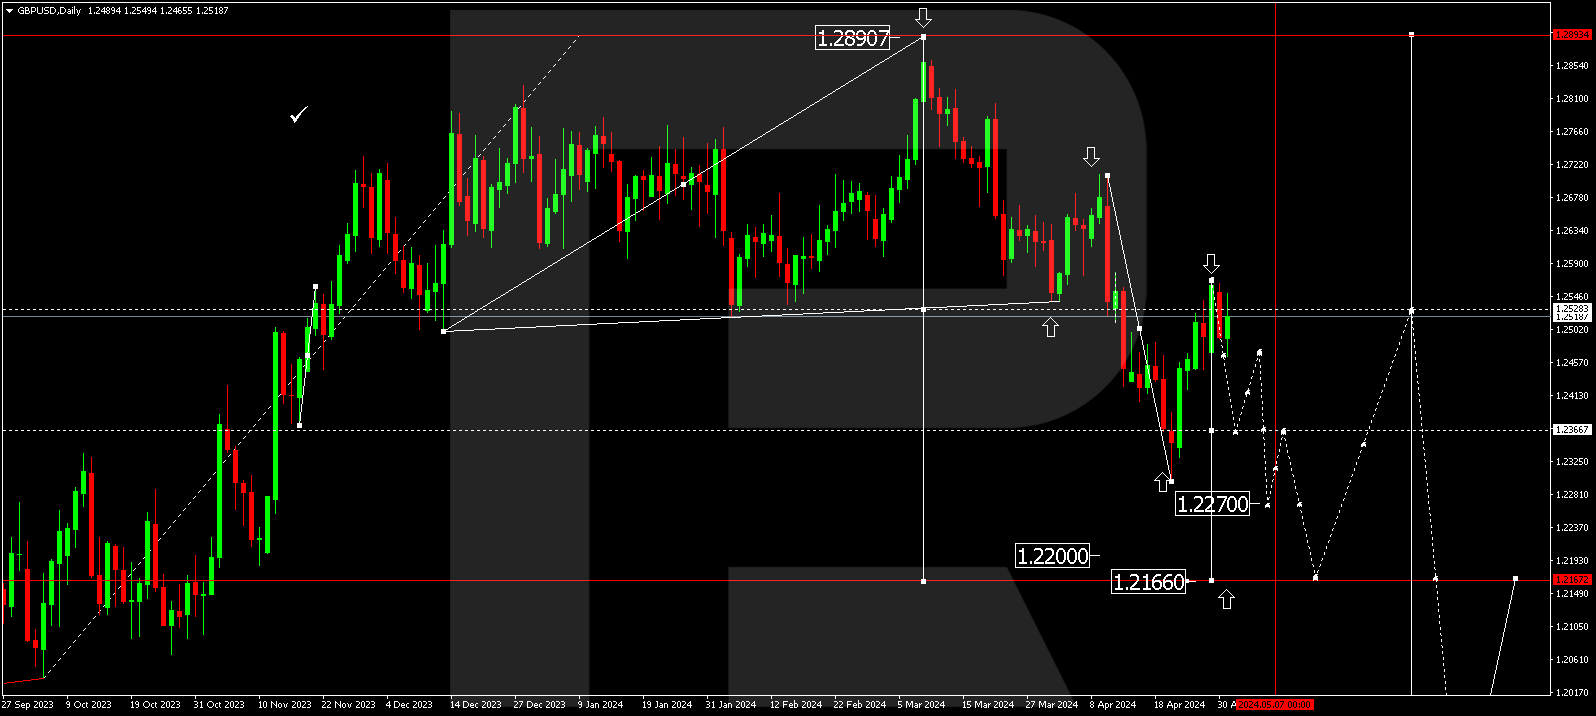
GBPUSD, “Great Britain Pound vs US Dollar”
In the daily chart, after finishing the descending wave at 1.0343 along with the ascending impulse to test 1.1333 from below, GBPUSD continues trading downwards with the target at 1.0738 and may even extend this structure down to 1.0170. Later, the market may form a new wave to the upside to reach 1.2200.

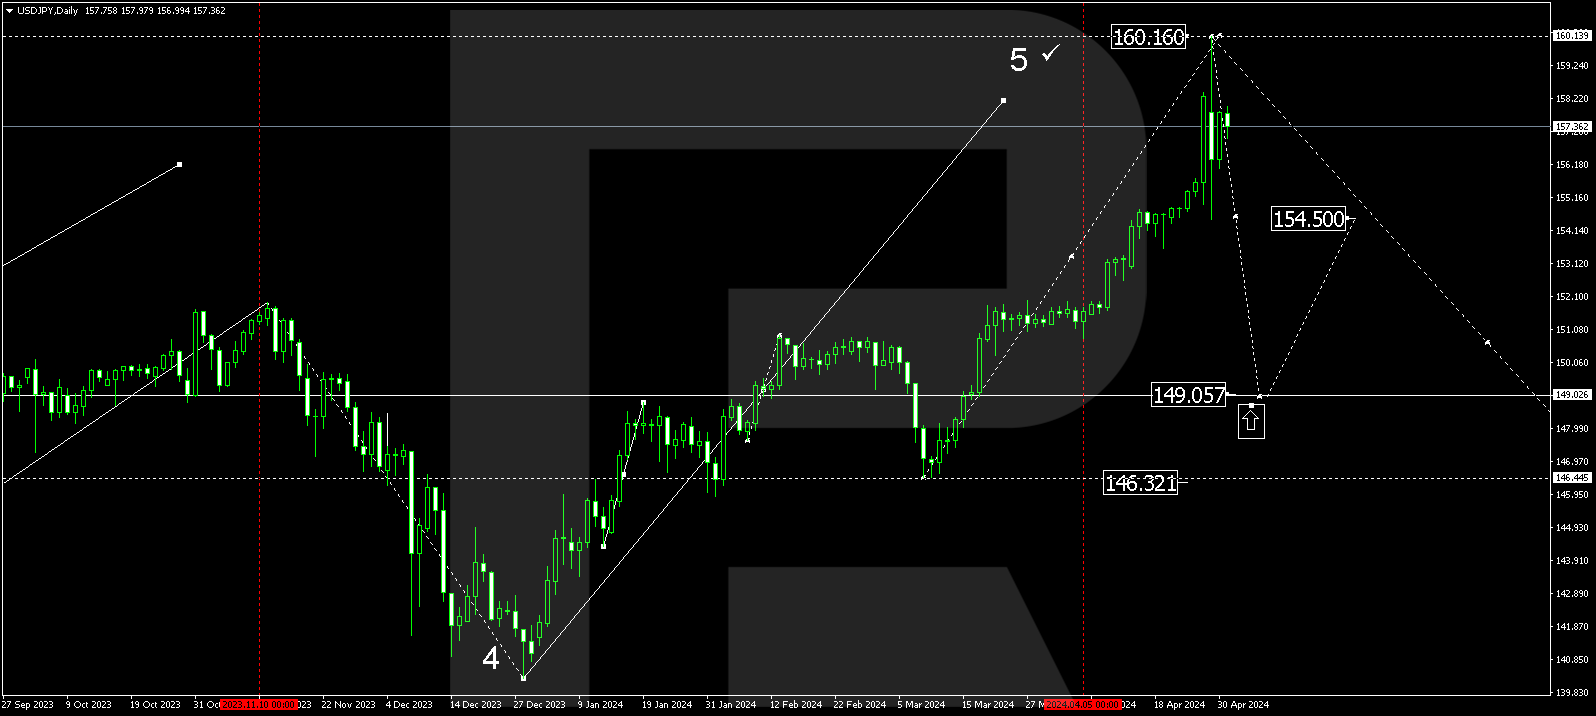
USDJPY, “US Dollar vs Japanese Yen”
In the daily chart, after completing the correctional wave at 140.40, USDJPY is forming another ascending wave to break 144.88. Later, the market may continue trading upwards with the target at 149.00, or even extend this structure up to 150.77.

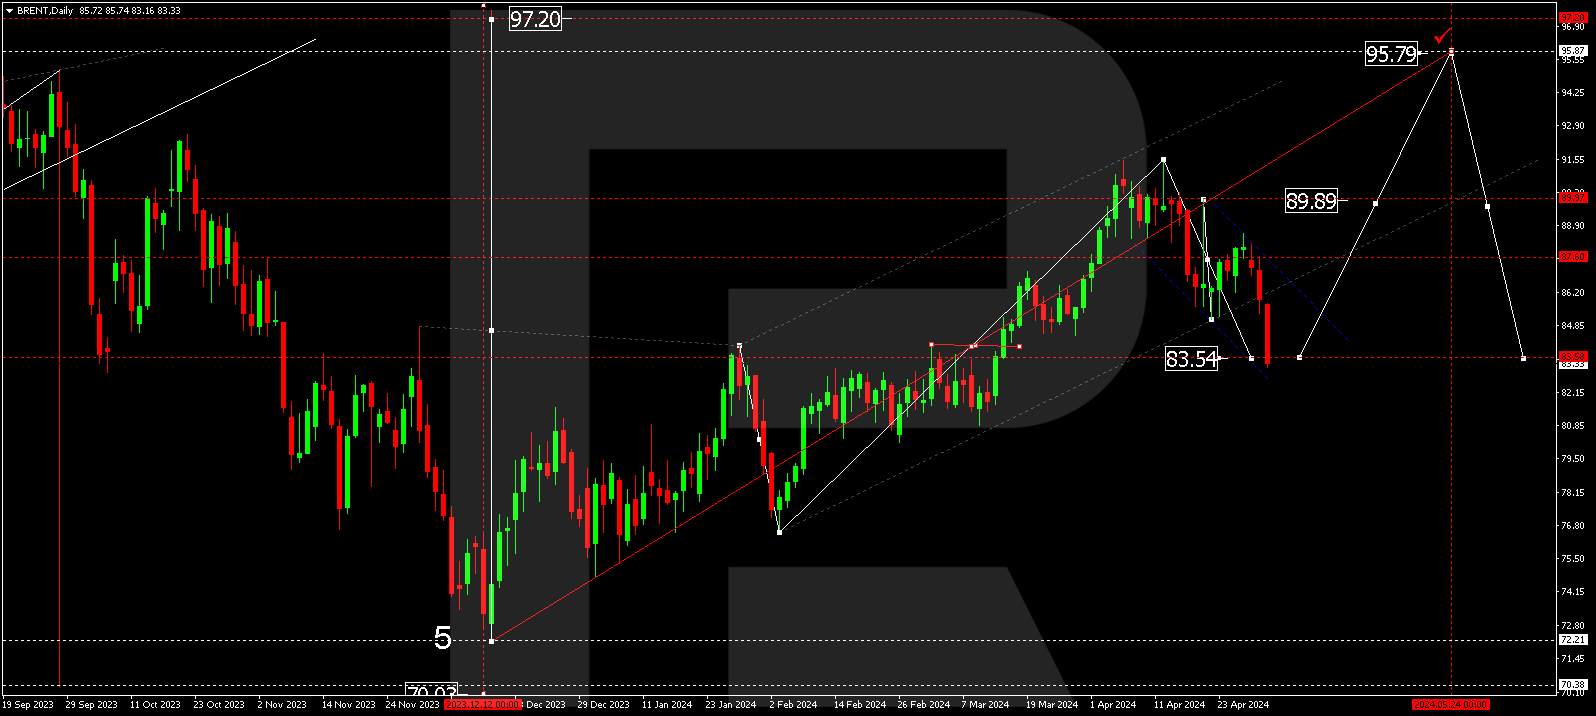
BRENT
As we can see in the daily chart, after reaching the predicted downside target at 83.73 and breaking the descending channel, Brent is growing to reach 90.80 – this movement should be considered the first part of the ascending wave towards 95.10. Later, the market may correct down to 90.00 and then resume trading upwards with the target at 107.40.

XAUUSD, “Gold vs US Dollar”
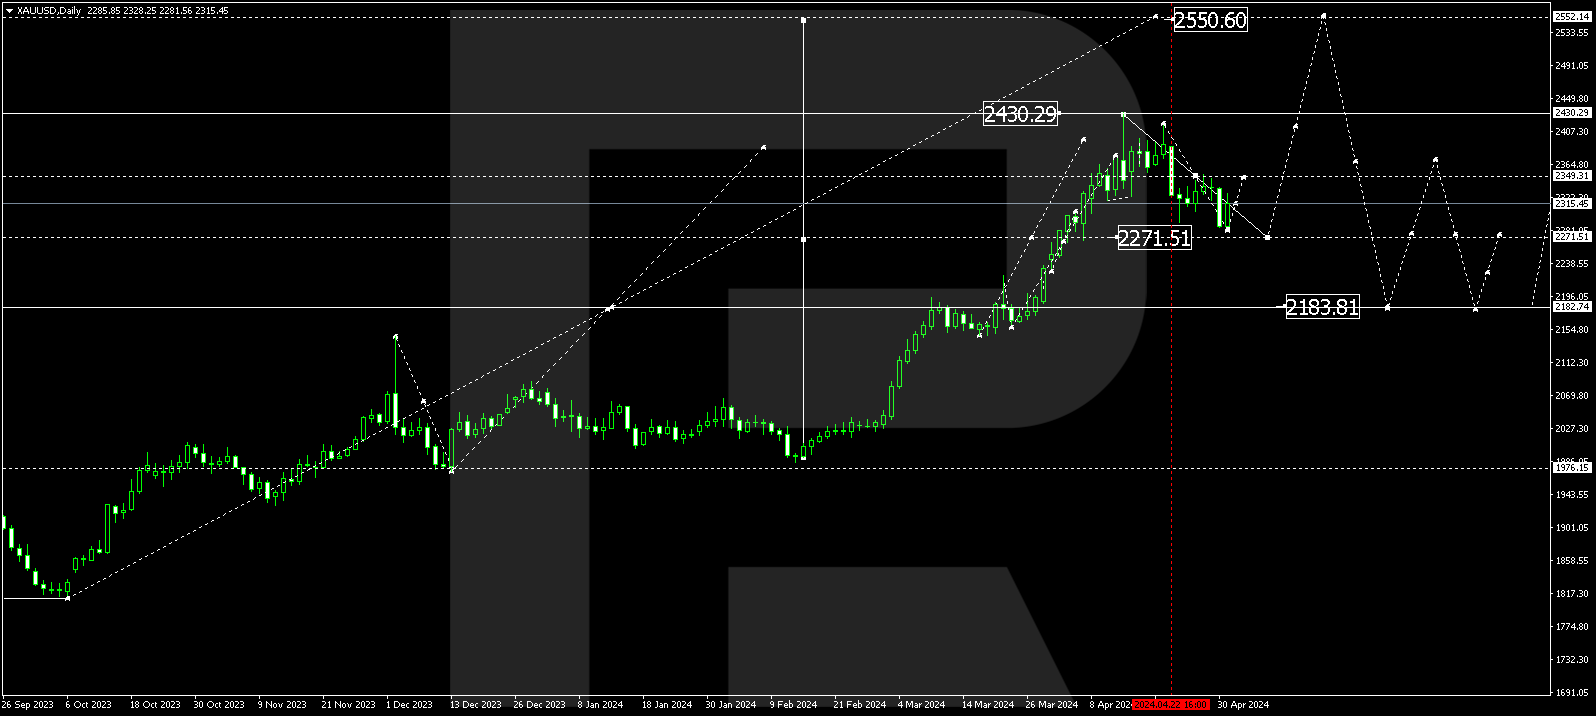
In the daily chart, after completing the descending wave at 1615.00, Gold is forming the first ascending wave towards 1703.00. Later, the market may correct down to 1660.00 and then start another growth with the first target at 1850.00.

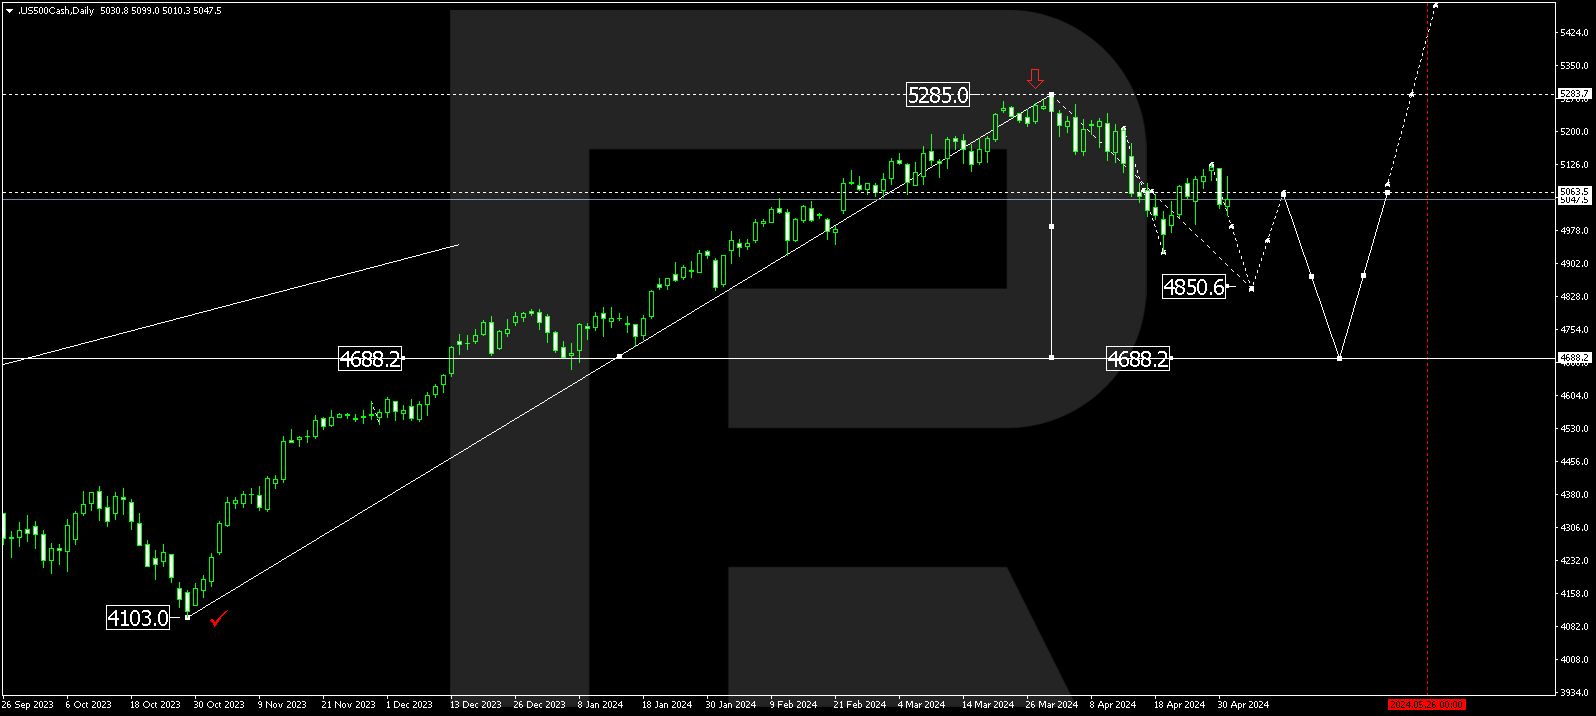
S&P 500
In the daily chart, after finishing the descending wave and reaching the short-term downside target at 3624.0, the S&P index is correcting. Possibly, the asset may grow to test 3890.0 from below and then resume falling with the key target at 3460.0.
