USDCAD, “US Dollar vs Canadian Dollar”
USDCAD has found a foothold under the lower boundary of the Triangle pattern. The instrument is going below the Ichimoku Cloud, which suggests a downtrend. A test of the lower boundary of the Cloud at 1.3435 is expected, followed by a decline to 1.3255. An additional signal confirming the decline could be a rebound from the lower boundary of the Triangle pattern. The scenario could be cancelled by a breakout of the upper boundary of the Cloud with the price finding a foothold above 1.3495, which will mean a further rise to 1.3585.


XAUUSD, “Gold vs US Dollar”
Gold is rebounding from the resistance level. The instrument is going above the Ichimoku Cloud, which suggests an uptrend. A test of the lower boundary of the Cloud at 2020 is expected, followed by a rise to 2065. An additional signal confirming the rise could be a rebound from the upper boundary of the bearish channel. The scenario could be cancelled by a breakout of the lower boundary of the Cloud with the price finding a foothold under 2015, which will mean a further decline to 1985. Meanwhile, the growth could be supported by a breakout of the upper boundary of the bearish channel with the price finding a foothold above the 2040 level.


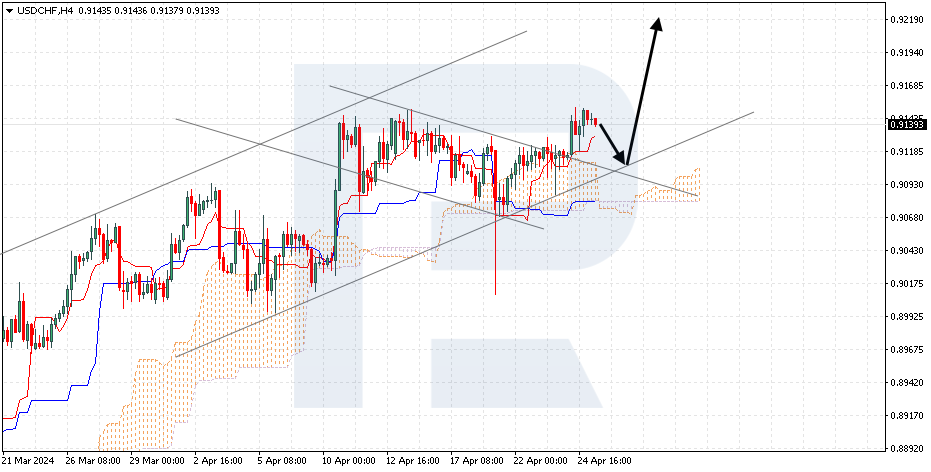
USDCHF, “US Dollar vs Swiss Franc”
USDCHF is rebounding from the broken boundary of the bullish channel. The instrument is going inside the Ichimoku Cloud, which suggests a sideways trend. A test of the Tenkan-Sen line at 0.8635 is expected, followed by a decline to 0.8465. An additional signal confirming the decline could be a rebound from the upper boundary of the bearish channel. The scenario could be cancelled by a breakout of the upper boundary of the Cloud with the price finding a foothold above 0.8695, which will mean a further rise to 0.8785.

