XAUUSD, “Gold vs US Dollar”
As we can see in the H4 chart, after forming a Long-Legged Doji reversal pattern not far from the support level, XAUUSD is reversing and may continue forming its rising impulse. In this case, the upside target is the resistance area at 1830.00. At the same time, an opposite scenario implies that the price may correct to reach 1795.00 first and then resume its ascending tendency.


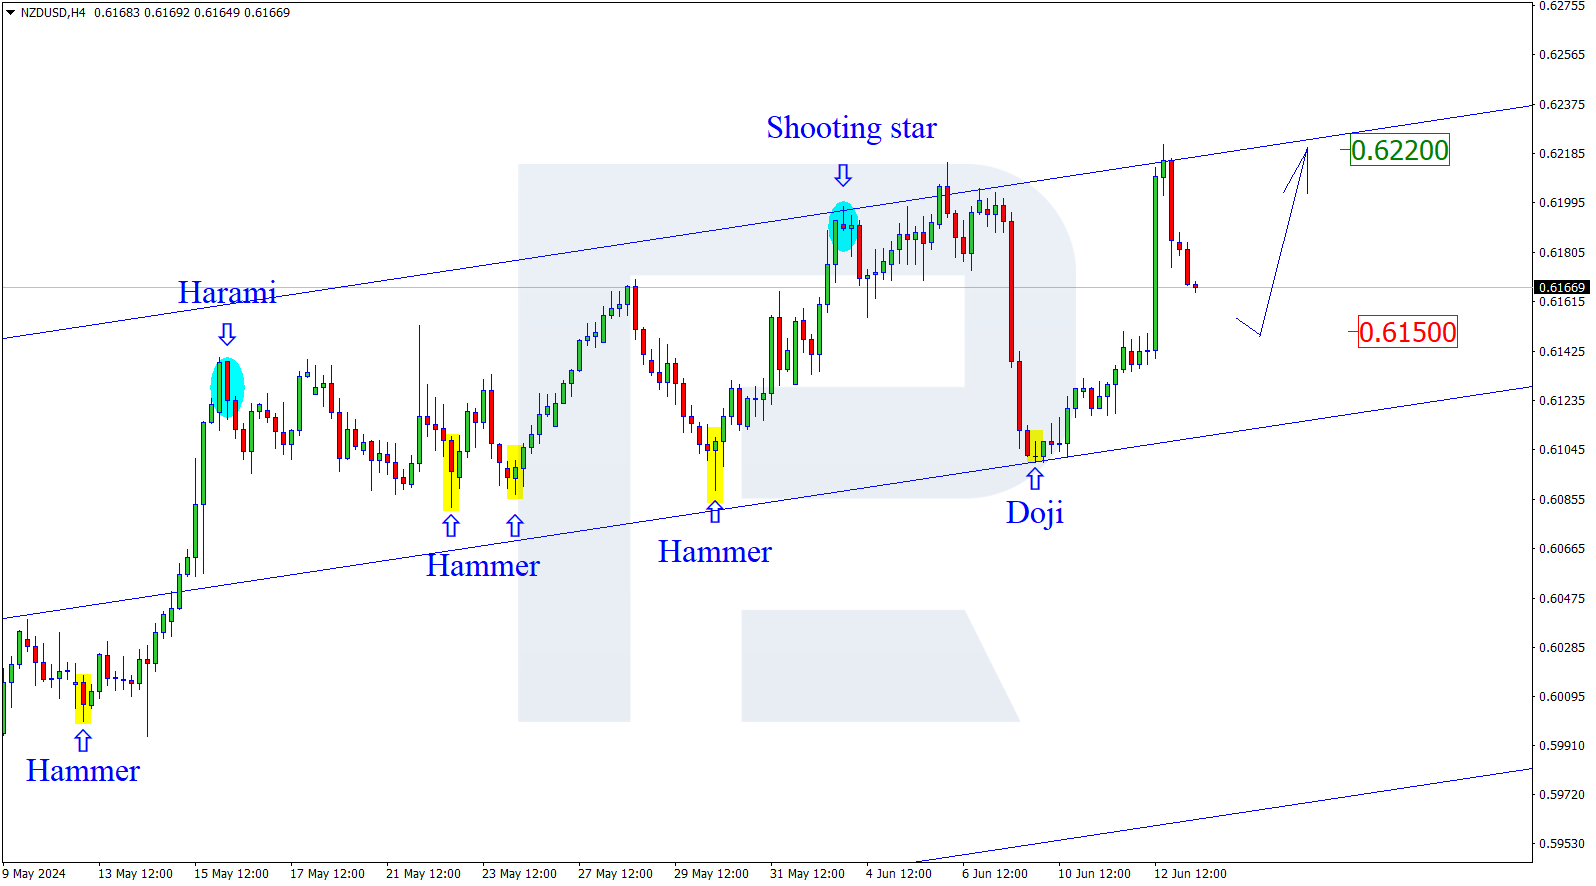
NZDUSD, “New Zealand vs US Dollar”
As we can see in the H4 chart, NZDUSD has formed a Hammer reversal pattern. At the moment, the asset is reversing and may form a new correctional impulse towards the resistance level. In this case, the upside target is at 0.6635. After that, the asset may rebound from this level and resume moving downwards. However, an alternative scenario implies that the price may fall to reach 0.6530 and continue its downtrend without forming any corrections.
GBPUSD, “Great Britain Pound vs US Dollar”
As we can see in the H4 chart, GBPUSD has formed an Inverted Hammer reversal pattern near the support area. At the moment, the pair is reversing in the form of a new ascending impulse. In this case, the upside target may be at 1.3495. After testing the resistance level, the market may rebound from it and resume trading downwards. Still, there might be an alternative scenario, according to which the asset may fall to reach 1.3330 without testing the channel’s upside border.
