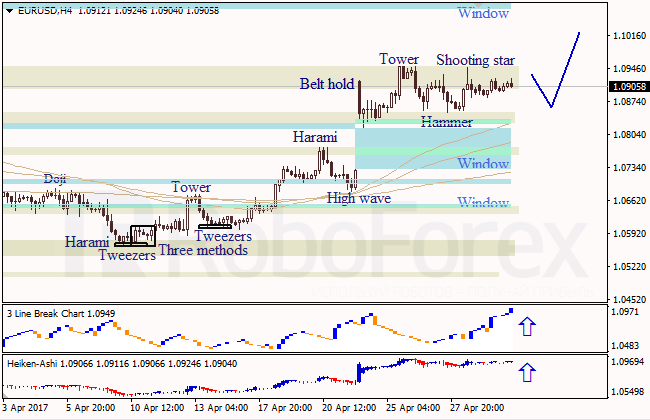
EUR USD, “Euro vs. US Dollar”
At the H4 chart of EUR USD, the sideways correction continues. The downside Window is a support level; bearish Shooting Star pattern indicates a descending movement. Three Line Break chart and Heiken Ashi candlesticks confirm a bullish direction.
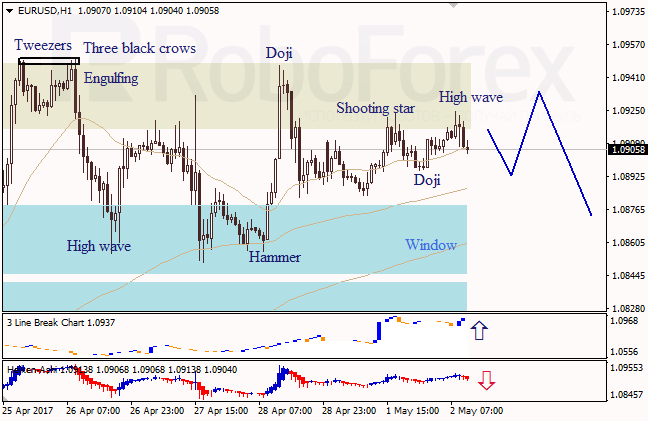
At the H1 chart of EUR USD, bearish High Wave pattern indicates a bearish pullback. The upside Window provided support. Three Line Break chart shows a bullish direction; Heiken Ashi candlesticks confirm a descending movement.
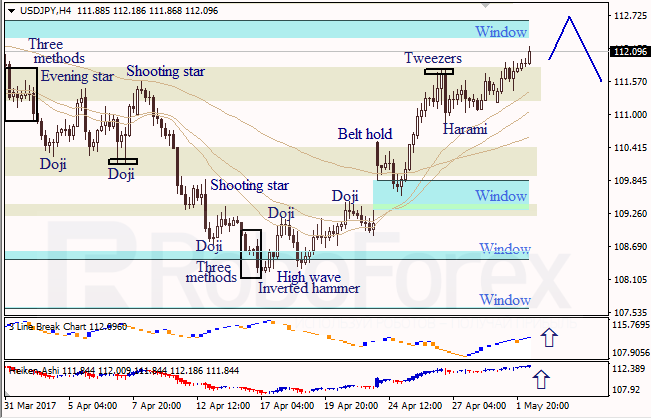
USD JPY, “US Dollar vs. Japanese Yen”
At the H4 chart of USD JPY, the upside Window is a resistance level. Candlesticks are bullish, there are no reversal patterns. Three Line Break chart and Heiken Ashi candlesticks confirm a bullish direction.
RoboForex Analytical Department