EUR USD, “Euro vs. US Dollar”
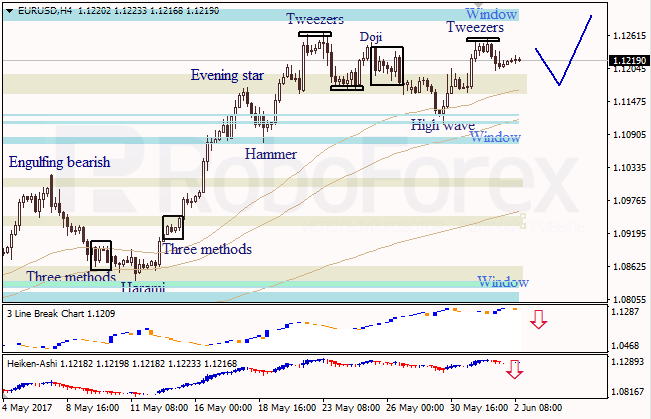
At the H4 chart of EUR USD, bearish Tweezers pattern indicates a pullback to the downside. The upside Window is a resistance level. Three Line Break chart and Heiken Ashi candlesticks confirm a descending movement.
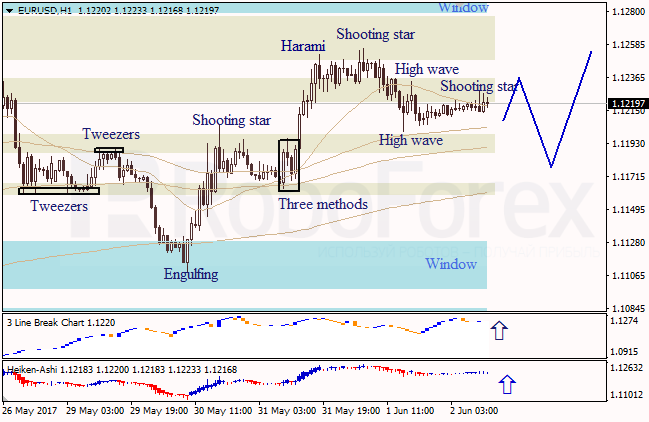
At the H1 chart of EUR USD, the sideways correction continues. Candlesticks are directed in opposite directions. Shooting Star pattern indicates a pullback to the downside. Three Line Break chart and Heiken Ashi candlesticks confirm a bullish direction.
USD JPY, “US Dollar vs. Japanese Yen”
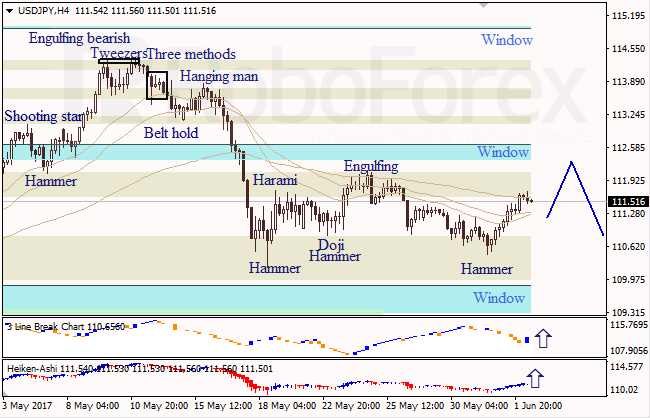
At the H4 chart of USD JPY, the sideways correction continues. Bullish Hammer pattern indicated an ascending movement. The Window in the middle is a resistance level. Three Line Break chart and Heiken Ashi candlesticks confirm a bullish direction.
RoboForex Analytical Department