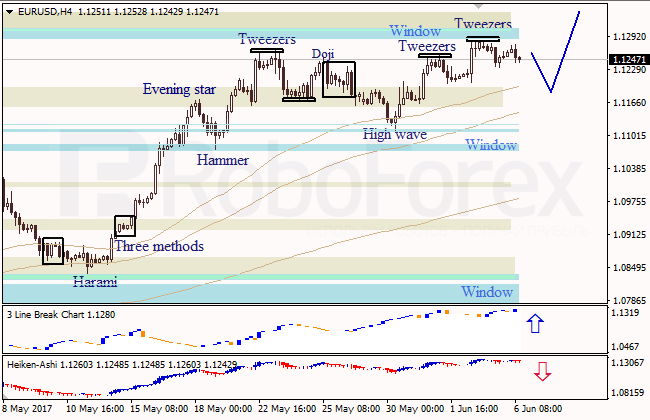
EUR USD, “Euro vs. US Dollar”
The H4 chart of EUR USD shows the uptrend. Bearish Tweezers pattern indicates that the descending correction continues. The upside Window provided resistance. Three Line Break chart shows the uptrend; Heiken Ashi candlesticks confirm the descending correction.
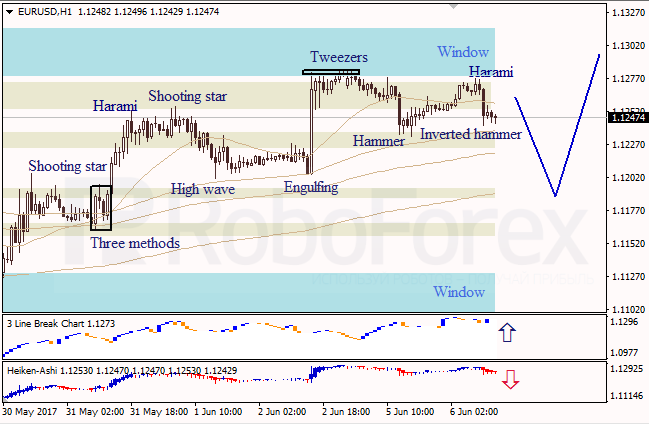
The H1 chart of EUR USD shows a sideways correction. Bearish Harami pattern indicates a descending movement. The upside Window provided resistance. Three Line Break chart shows a bullish direction; Heiken Ashi candlesticks confirm the descending correction.
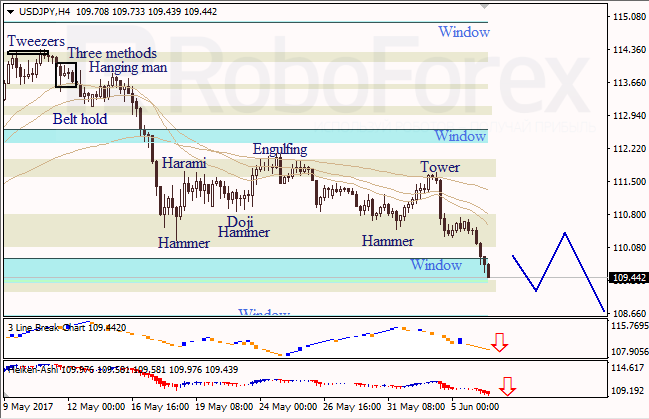
USD JPY, “US Dollar vs. Japanese Yen”
At the H4 chart of USD JPY, the downtrend continues. Candlesticks are bearish; there are no reversal patterns right now. The downside Window is a support level. Three Line Break chart and Heiken Ashi candlesticks confirm a bearish direction.
RoboForex Analytical Department