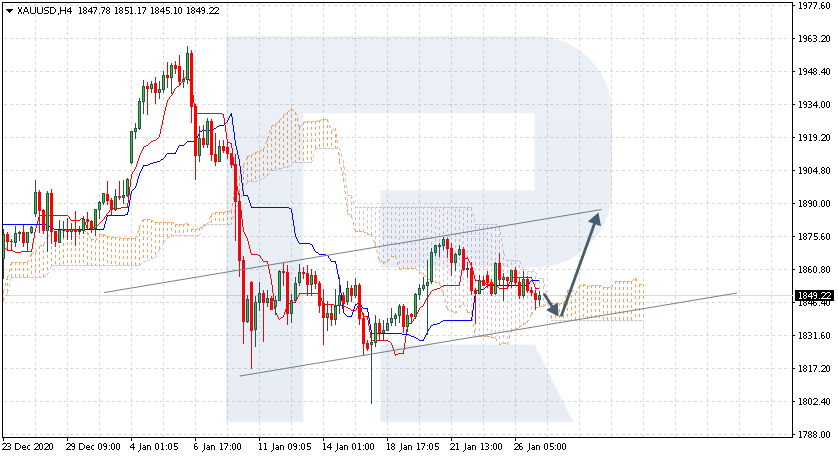
XAUUSD, “Gold vs US Dollar”
As we can see in the H4 chart, after testing another resistance level and forming several reversal patterns, such as Shooting Star, Gold is trading inside the horizontal channel and trying to reverse. The current situation implies that the pair may form a correction from the resistance level and then resume the rising tendency. In this case, the upside target may be at 1700.00. At the same time, there is another scenario, according to which the instrument may correct to reach the support level at 1580.00.

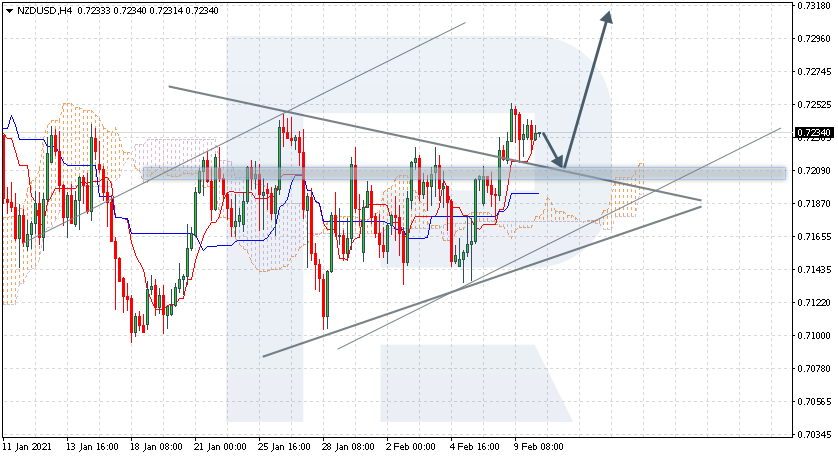
NZDUSD, “New Zealand vs. US Dollar”
As we can see in the H4 chart, the rising channel continues. After finishing a Doji reversal pattern, NZDUSD is reversing. Possibly, the pair complete the correction and resume trading upwards. The upside target may be at 0.6150. Still, one shouldn’t exclude another scenario, which says that the instrument may continue falling towards 0.5942.
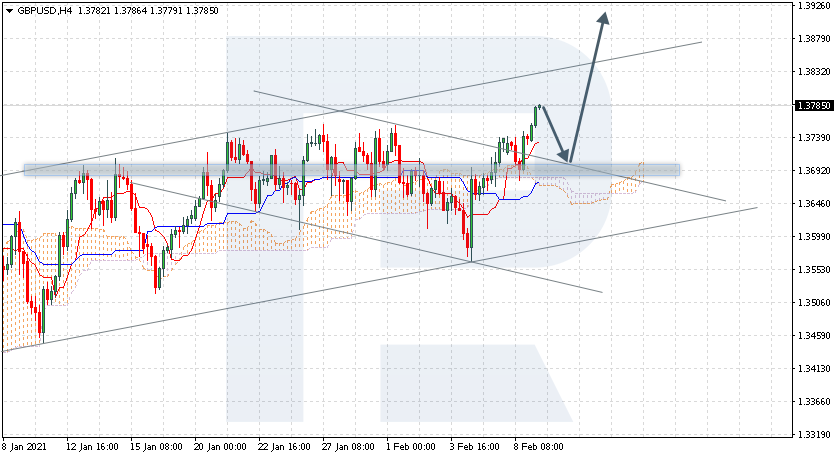
GBPUSD, “Great Britain Pound vs US Dollar”
As we can see in the H4 chart, the pair continues moving within the rising tendency. By now, GBPUSD has formed several reversal patterns, such as Long-Legged Doji, close to the support level. At the moment, the pair is reversing and may later resume growing with the target at 1.2640. However, there is another scenario, which implies that the instrument may fall and test 1.2150.