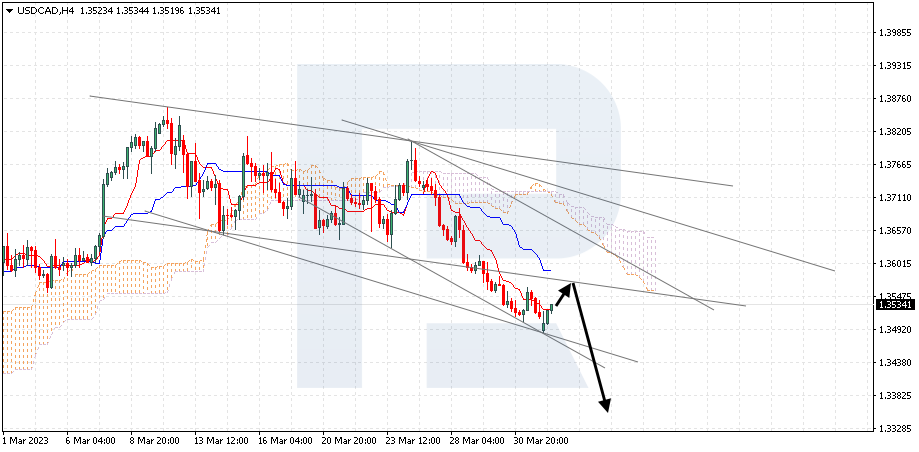
USDCAD, “US Dollar vs Canadian Dollar”
As we can see in the H4 chart, after breaking the descending channel’s upside border, USDCAD has formed Doji reversal pattern close to the resistance level. Right now, the pair is trying to reverse. Later, the price may continue falling towards the channel’s upside border at 1.3118. However, we shouldn’t ignore an alternative scenario, according to which the instrument may break the resistance level and continue growing towards 1.3294.


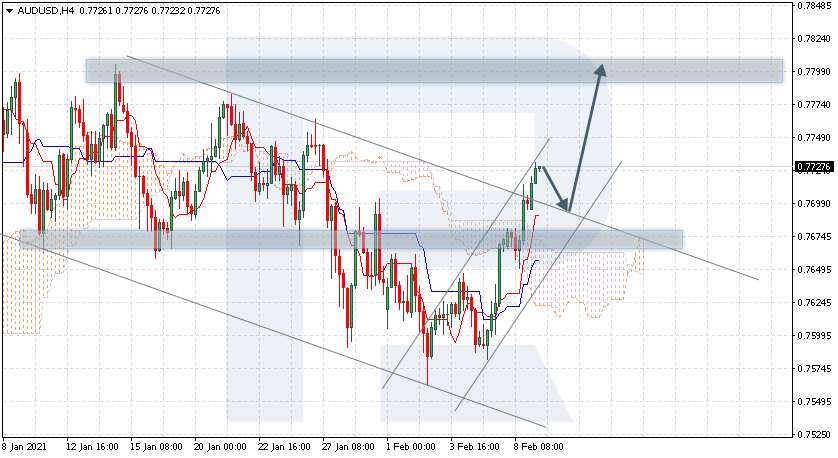
AUDUSD, “Australian Dollar vs US Dollar”
As we can see in the H4 chart, AUDUSD has formed another reversal pattern, Harami, close to the rising channel’s downside border. At the moment, the pair is reversing. Judging by the previous movements, we may assume that after completing the correction the price may reverse and then grow towards 0.6945. However, we shouldn’t ignore an alternative scenario, which implies that the instrument may resume falling to reach 0.6835.

