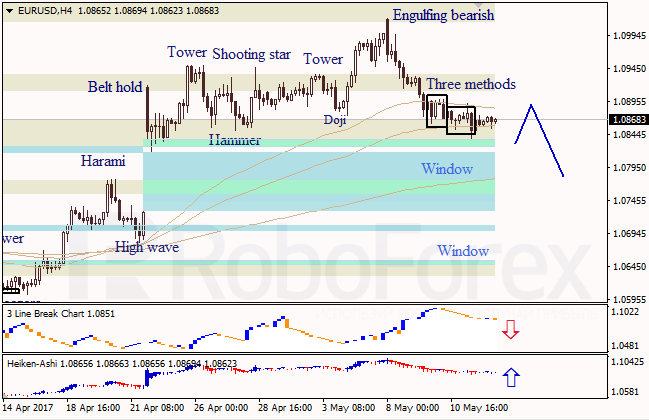
EUR USD, “Euro vs. US Dollar”
At the H4 chart of EUR USD, the descending correction continues. The Window in the middle is still open; it’s a support level. Bearish Three Methods continuation pattern confirms the descending correction and a possible closure of the Window; Three Line Break chart shows a bearish direction; Heiken Ashi candlesticks confirm a possible pullback to the upside.
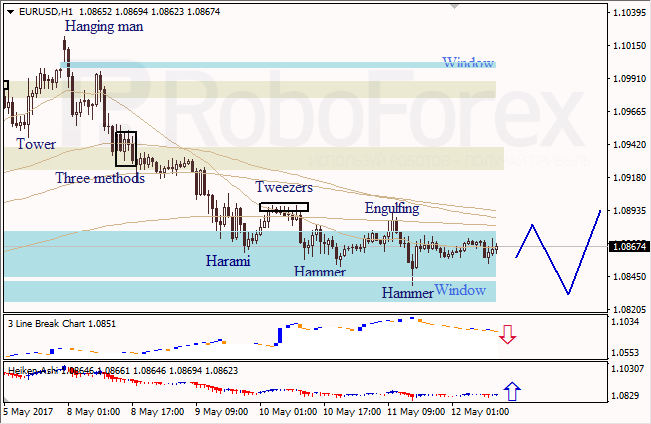
At the H1 chart of EUR USD, the sideways correction continues inside the downside Window. Bullish Hammer reversal pattern indicates an ascending movement. Three Line Break chart shows a bearish direction; Heiken Ashi candlesticks confirm the ascending movement.
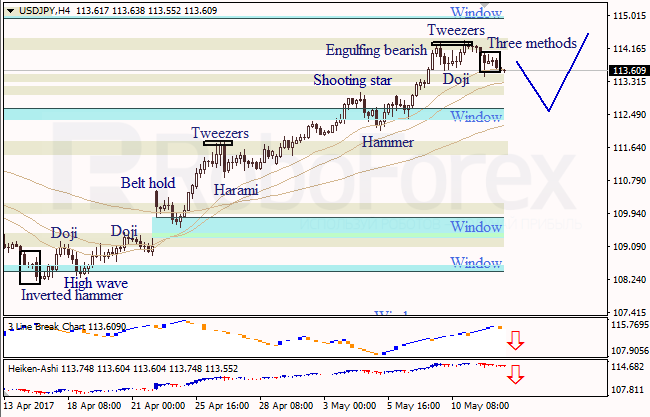
USD JPY, “US Dollar vs. Japanese Yen”
At the H4 chart of USD JPY, Engulfing Bearish, Tweezers, and Three Methods patterns indicate that the descending correction continues. The Window in the middle is a support level. Three Line Break chart and Heiken Ashi candlesticks confirm a bearish direction.
RoboForex Analytical Department