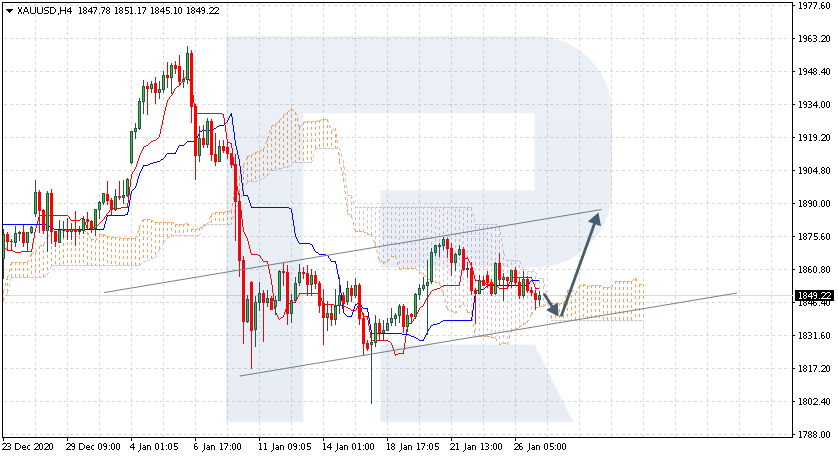
XAUUSD, “Gold vs US Dollar”
As we can see in the H4 chart, after testing the support level, XAUUSD has formed a Doji reversal pattern. At the moment, the pair is reversing. In this case, the price may finish the correction and then resume growing with the target at 1737.85. At the same time, the instrument may choose an opposite scenario and return to 1684.00.

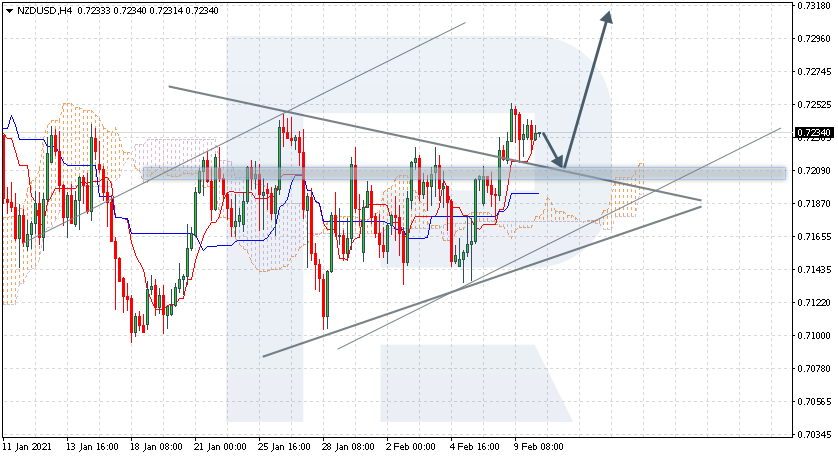
NZDUSD, “New Zealand vs. US Dollar”
As we can see in the H4 chart, NZDUSD is testing the rising channel’s downside border and forming a reversal pattern. In case the pair succeeds and starts reversing, it may rebound from the support level and resume growing towards 0.6140. Still, one shouldn’t exclude another scenario, which says that the instrument may continue the descending tendency to reach 0.5959.
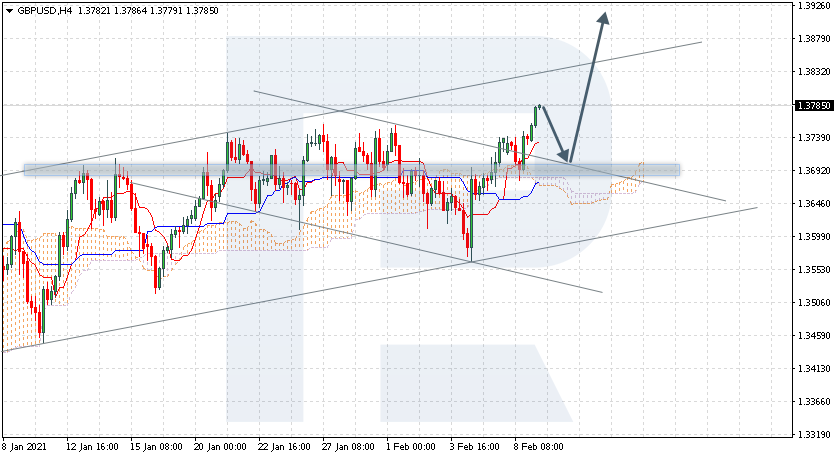
GBPUSD, “Great Britain Pound vs US Dollar”
As we can see in the H4 chart, after forming a Hammer reversal pattern, GBPUSD is falling towards the support area. At the moment, the pair is expected to reverse and form a slight correction, which may later be followed by a new descending impulse. In this case, the downside target may be at 1.2208. However, there is another scenario, which implies that the instrument may return to 1.2390.