EUR USD, “Euro vs. US Dollar”
At the H4 chart of EUR USD, bullish Inverted Hammer pattern indicated an ascending movement. Three Line Break chart and Heiken Ashi candlesticks show a bearish direction; Harami pattern confirms a pullback to the downside.

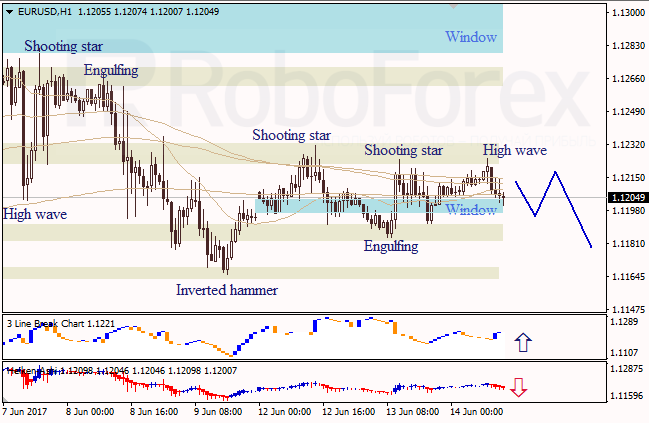
At the H1 chart of EUR USD, High Wave pattern indicates a bearish pullback. The new Window provides support. Three Line Break chart shows a bullish direction; Heiken Ashi candlesticks confirm a descending movement.
USD JPY, “US Dollar vs. Japanese Yen”
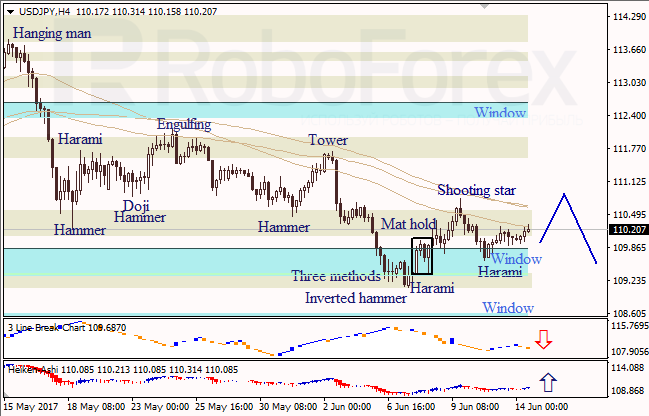
At the H4 chart of USD JPY, bullish Harami reversal pattern indicates an ascending movement. The closest Window provided support. Three Line Break chart shows a bearish direction; Heiken Ashi candlesticks confirm the ascending movement.
RoboForex Analytical Department