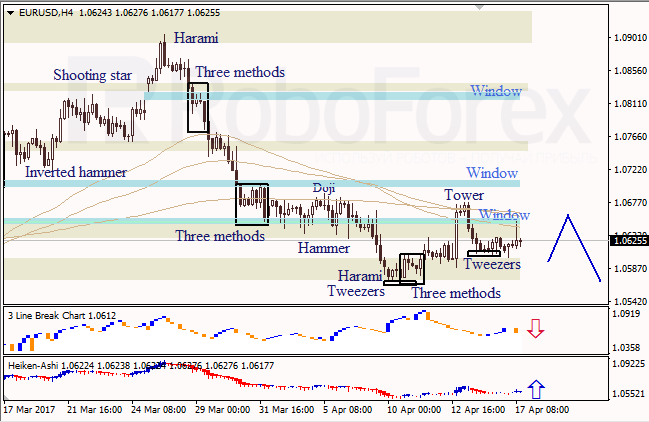
EUR USD, “Euro vs. US Dollar”
At the H4 chart of EUR USD, the Window in the middle provided resistance. Three Line Break chart shows a bearish direction; Heiken Ashi candlesticks and Tweezers pattern confirms a bullish pullback towards resistance from the closest Window.
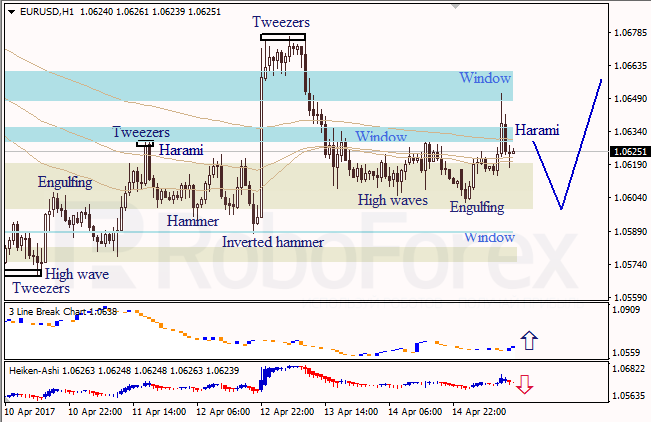
At the H1 chart of EUR USD, bearish Harami pattern indicated a descending movement. The Window in the middle provided resistance. Three Line Break chart shows a bullish direction; Heiken Ashi candlesticks confirm a pullback to the downside.
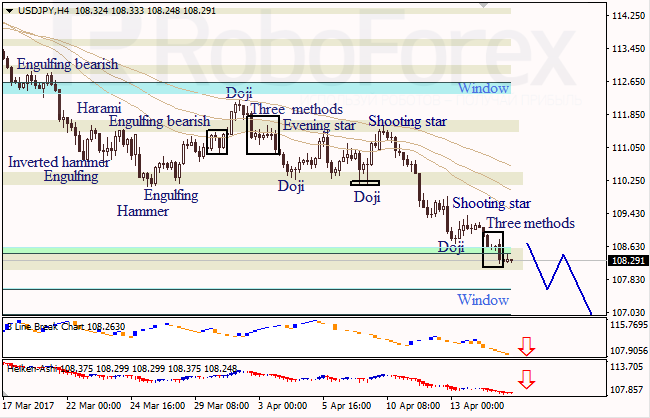
USD JPY, “US Dollar vs. Japanese Yen”
At the H4 chart of USD JPY, bearish Three Methods pattern indicates a descending movement. The downside and middle Windows are support levels. Three Line Break chart and Heiken Ashi candlesticks confirm a bearish direction.
RoboForex Analytical Department