EUR USD, “Euro vs. US Dollar”
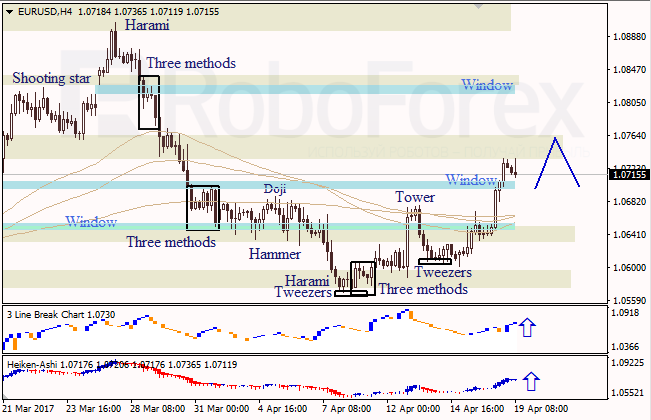
At the H4 chart of EUR USD, the Window in the middle was broken to the upside; now it’s a support level. There are no reversal patterns right now. Three Line Break chart and Heiken Ashi candlesticks confirm a bullish direction.
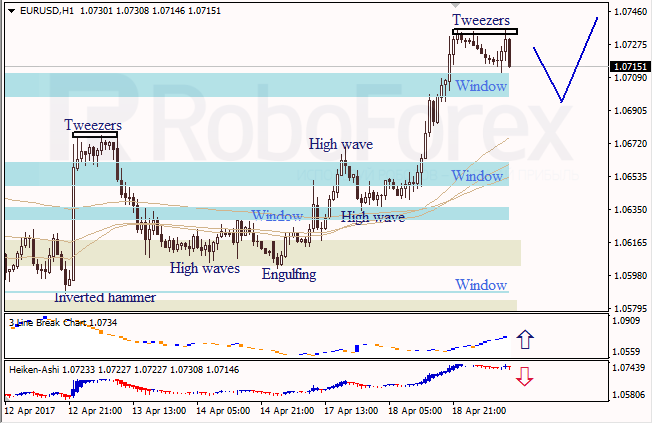
At the H1 chart of EUR USD, bearish Tweezers pattern indicates a descending movement. The upside Window is a support level. Three Line Break chart shows a bullish direction; Heiken Ashi candlesticks confirm a pullback to the downside.
USD JPY, “US Dollar vs. Japanese Yen”
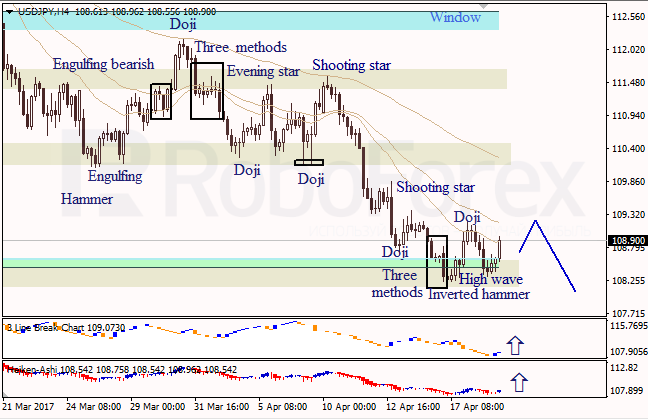
At the H4 chart of USD JPY, bullish High Wave pattern indicated that the ascending correction continues. The downside Window provided support. Three Line Break chart and Heiken Ashi candlesticks confirm a bullish direction.
RoboForex Analytical Department