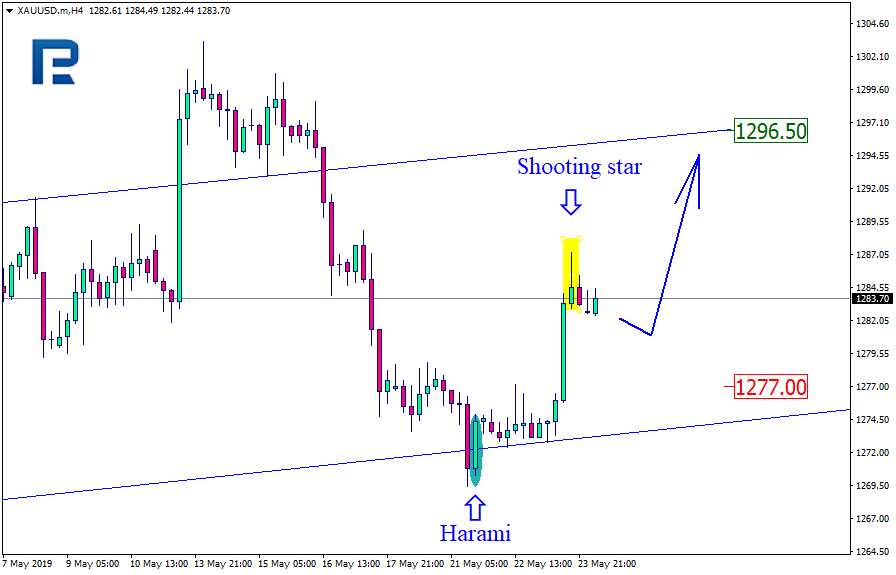
XAUUSD, “Gold vs US Dollar”
As we can see in the H4 chart, the ascending tendency continues. The pair has tested the channel’s downside border and formed Inverted Hamer reversal pattern; right now, it is being slightly corrected. After completing the pullback, the instrument may resume moving downwards to reach the support level at 1266.00.

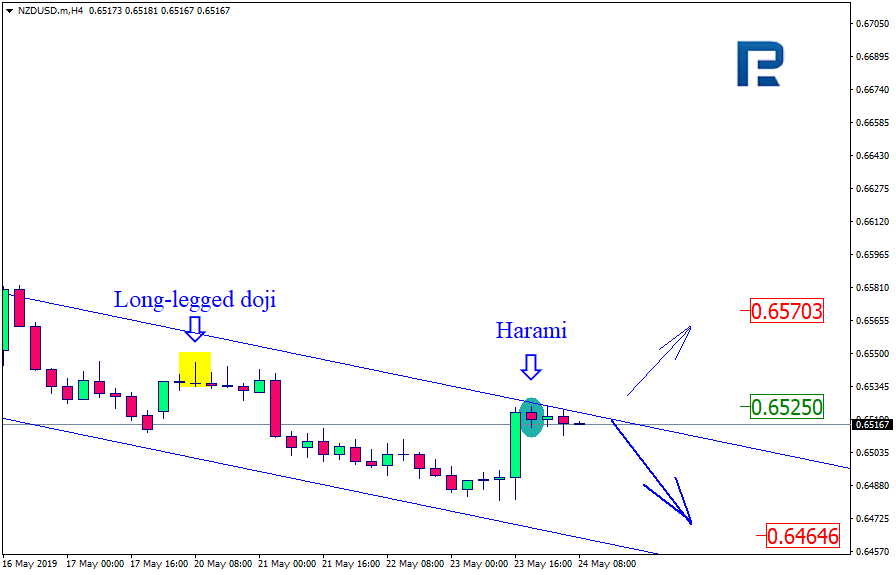
NZDUSD, “New Zealand vs. US Dollar”
As we can see in the H4 chart, NZDUSD has been trading downwards for quite a long time. It has formed Long-Legged Doji pattern close to the channel’s upside border, which resulted in a rebound and a new descending impulse. Right now, it may be assumed that the instrument may trade to reach its key target at 0.6480. Possibly, later the price may rebound towards 0.6540.