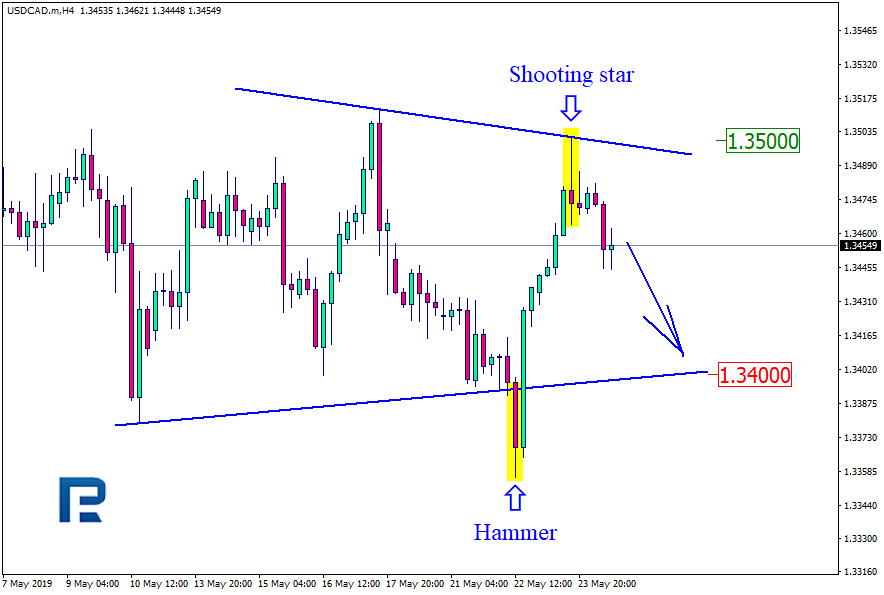
USDCAD, “US Dollar vs Canadian Dollar”
As we can see in the H4 chart, USDCAD is trading inside the triangle. After forming Hammer pattern, the price rebounded from the support level; right now, it is moving upwards. This ascending movement may reach 1.3470 and then the instrument may start a new correction towards 1.3380.

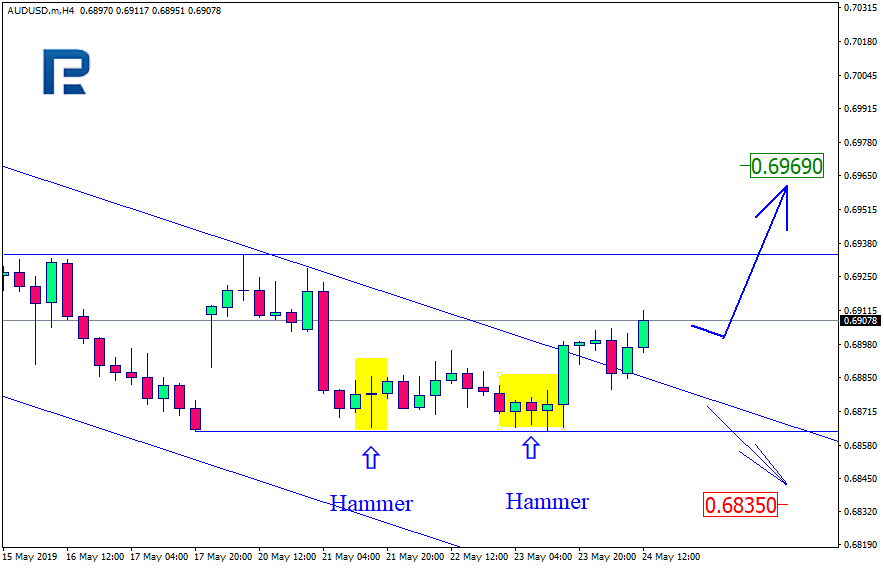
AUDUSD, “Australian Dollar vs US Dollar”
As we can see in the H4 chart, the descending tendency continues, while AUDUSD is trading sideways. Right now, the instrument is testing the support level and has already formed Hammer reversal pattern. Based on the above, we may assume that the price is going to reverse and reach 0.6900 and then continue the descending tendency towards 0.6834.